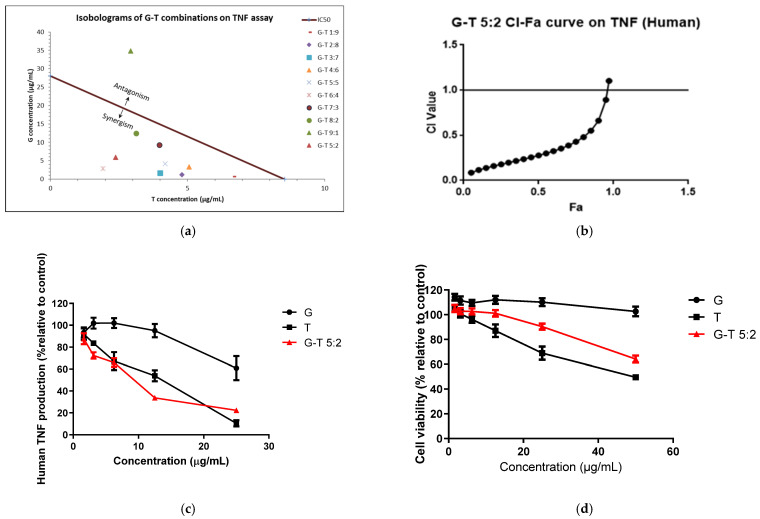
Figure 2.
Synergistic interaction of G-T combination s (1:9, 2:8, 3:7, 4:6, 5:5, 6:4, 7:3, 8:2, 9:1, 5:2, w/w) in in-hibiting LPS-induced TNF in THP-1 cells. Isobologram of G-T combinations in reducing TNF at IC50 (a), CI-Fa curve of G-T 5:2 (b), dose-response curves of G, T and G-T 5:2 on TNF assay (c) and cell viability (d) in THP-1 cells (n ≥ 3). The IC50 values of G and G-T 9:1 used in the isobologram (a) were estimated from the dose-response curves which were at 28.04 ± 3.99 and 38.70 ± 8.66 µg/mL, re-spectively.

