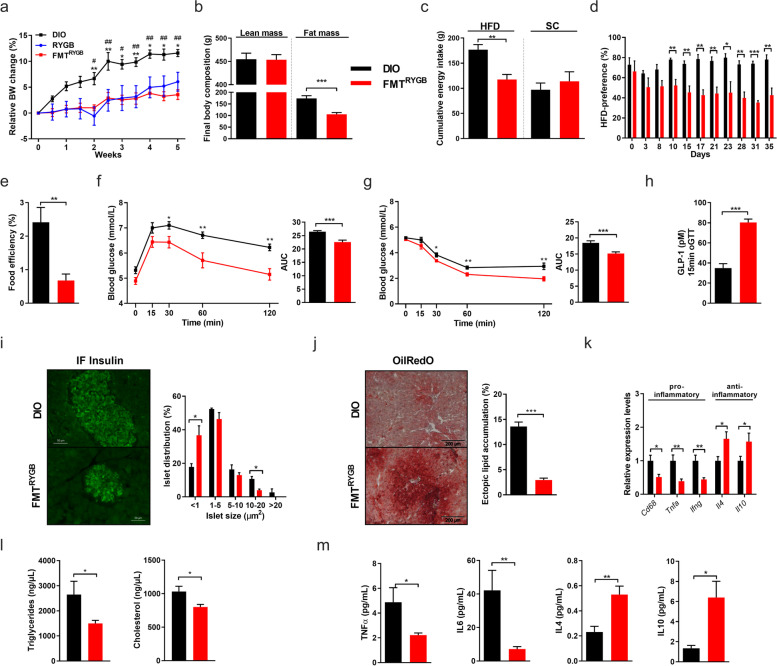
Fig. 2.
RYGB gut microbiota transfer counters adiposity and metabolic disease in conventionally raised HFD-induced obesity. a–e Relative body weight change (in %; øBW per group: DIO W0: 681.3 g, W5: 762.3 g; FMTRYGB W0: 528 g, W5: 595.2 g; RYGB W0: 415.3 g, W5: 437.7 g; * DIO vs. RYGB; # DIO vs. FMTRYGB) (a), final body composition with lean and fat mass (in g) (b), cumulative energy intake of HFD and SC (in g) (c), HFD preference (in %) (d) and food efficiency (in %) (e) in HFD-induced obese (DIO) rats 5 weeks after fecal microbiota transfer (FMT) from RYGB-operated rats (FMTRYGB) compared to DIO controls. f–i Oral glucose-tolerance tests (oGTT) (f), insulin sensitivity assessed by insulin-tolerance tests (ITT) (g), and plasma GLP-1 (in pM) release at 15 min after oral glucose exposure (h) 5 weeks after FMT. Representative immunofluorescent (IF) insulin-stained pancreas sections (scale bars 50 μm) and quantification of pancreatic islet sizes (in %) in FMTRYGB rats and DIO controls (i). j–m Liver OilRedO staining (scale bars 200 μm) with quantification of hepatic lipid accumulation (in %) (j). Hepatic cytokine gene expression (k), plasma lipid (in ng/μl) (l), and plasma cytokine levels (in pg/ml) (m) in FMTRYGB rats and DIO controls. Note that for clarity purposes and in order to reduce animal numbers, data from groups DIO and FMTRYGB have exceptionally also been used in Supplementary Figure S5. Data are mean ± s.e.m; n = 3–8 animals per group with pooled data from 2 to 3 independent experiments. *,# P < 0.05, **,## P < 0.01, ***,### P < 0.001 by unpaired Student’s t test (for two groups) or two-way ANOVA (multiple groups) with Tukey correction for multiple testing

