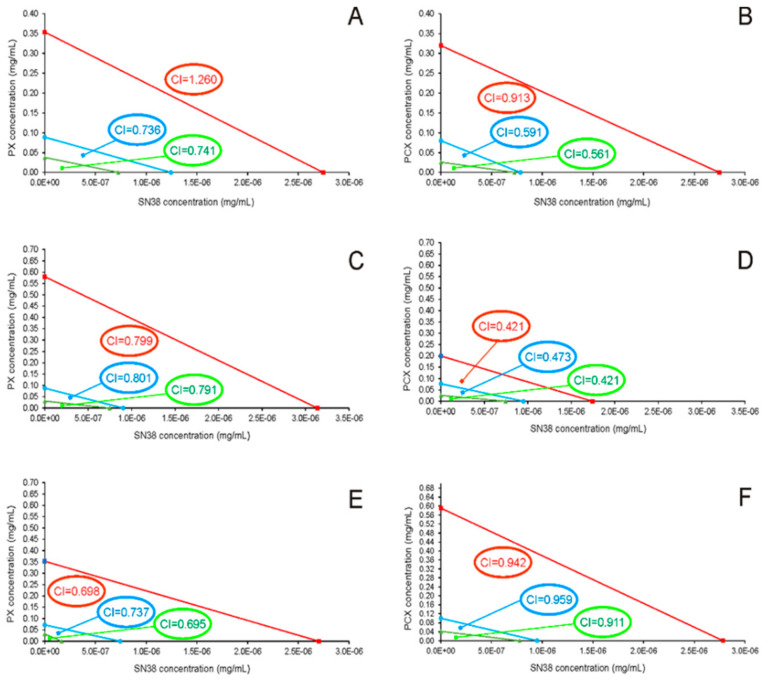
Figure 2.
Isobolograms for the interaction of PX (A,C,E) and PCX (B,D,F) with SN-38 in HCT-116 (A,B), Caco-2 (C,D), and HT-29 cells (E,F). The isobolograms were constructed by connecting the IC30 (triangles), IC50 (circles), and IC70 (squares) values of pectins with the appropriate IC values of SN-38. Lines indicate the theoretical lines of additivity.

