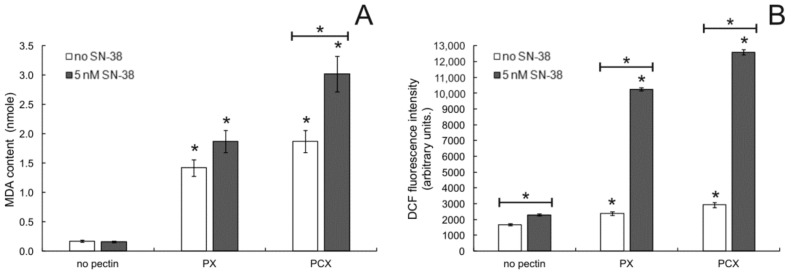
Figure 7.
Lipid peroxidation (A) and ROS level (B) in HT-29 cells treated with 0.2 mg/mL pectins and/or 5 nM SN-38 for 48 h. The means of three experiments ± SD are presented (* p < 0.05). Statistical significance was checked between the studied probes and controls (no pectin) as well as between probes containing only pectin and pectin combined with SN-38.

