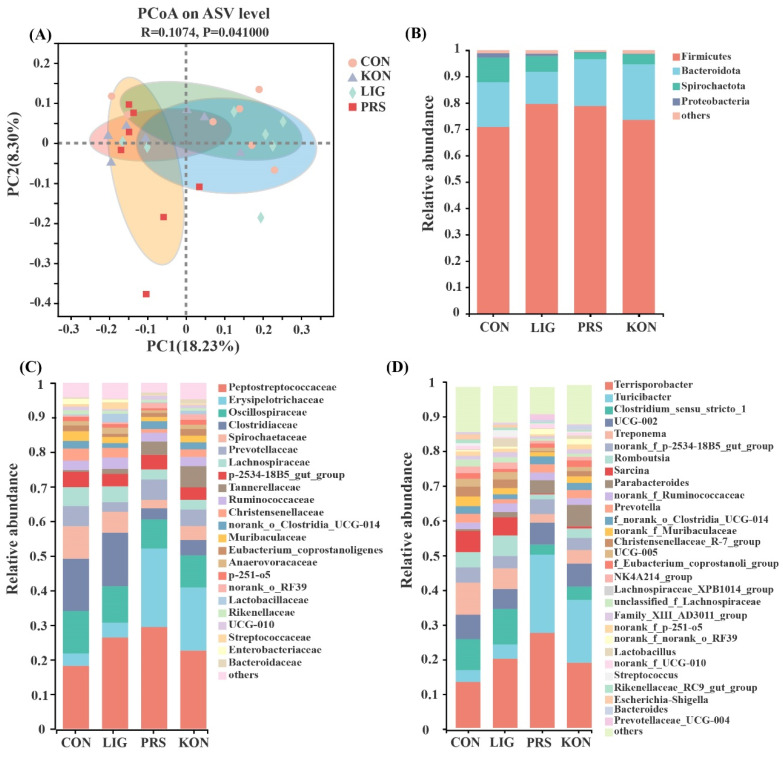
Figure 4.
Comparison of the composition of the fecal microbiome (n = 7). The principal coordinate analysis (PCoA) plots of the four groups (A). Microbial structure at the phylum level (B), family level (C), and genus level (D) in the feces of sows. CON, control; LIG, lignocellulose; PRS, resistant starch; KON, konjaku flour.

