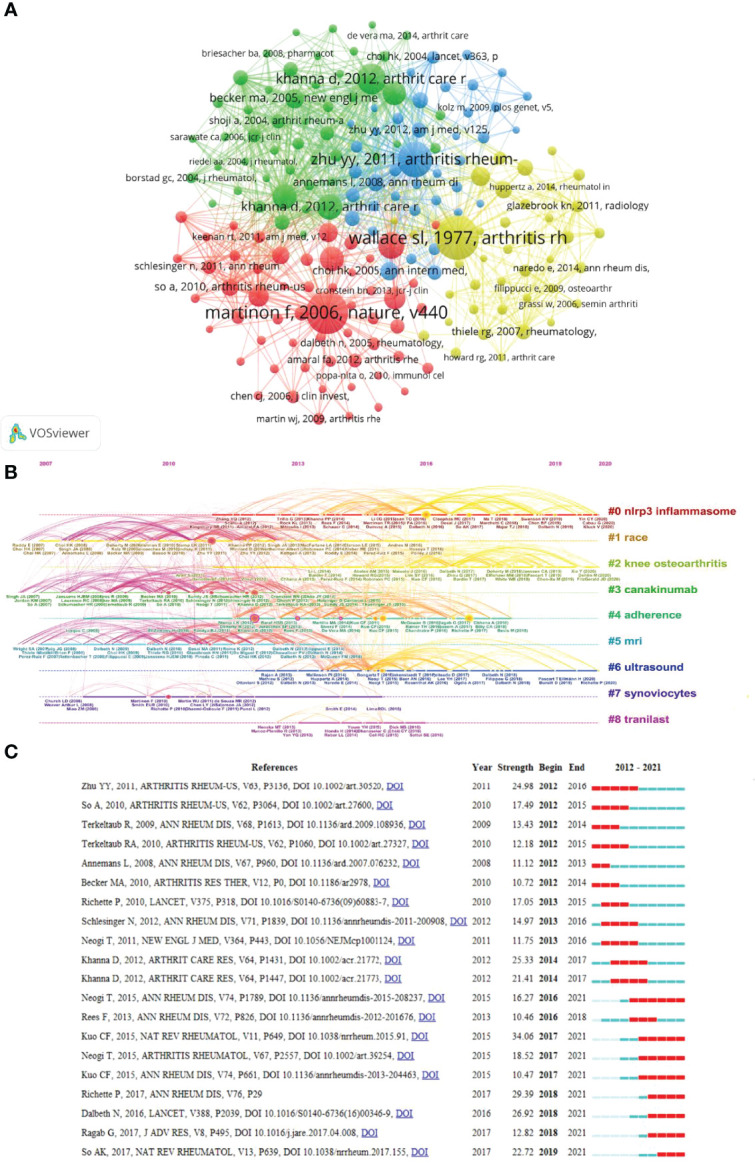
Figure 7.

Mapping based on co-cited references from GA-related research. (A) A network diagram of co-cited references. Of the 51775 references, 184 (divided into four clusters) were cited at least 30 times. (B) The top nine clusters’ timeline distribution. (C) The top 20 co-cited references with the most citation burstiness. The years between “Begin” and “End” represent the period when the reference was more influential. Years in light green mean that the reference has not yet appeared, years in dark green mean that the reference is less influential, and years in red mean that the reference is more influential.
