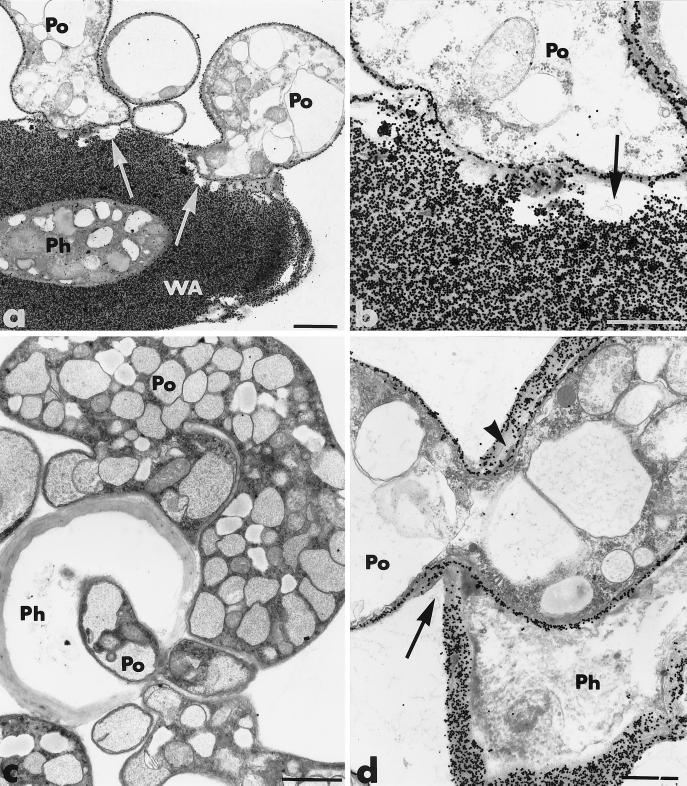
FIG. 4.
Transmission electron micrographs of mycelial samples, collected after 3 to 4 days of coculture of P. parasitica (Ph) and P. oligandrum (Po), in the region where the two fungi are interacting. (a and b) Lytic zones are free of exoglucanase-gold labeling (arrows). (a) WA, wall apposition. Bar, 1.5 μm. (b) Bar, 0.75 μm. (c and d) Host cell penetration is achieved by means of constricted hyphae of the antagonist (panel d, arrow). There is a decrease in gold labeling some distance from the fungal pathway (panel d, arrowhead). (c) Bar, 1.5 μm; (d) bar, 0.75 μm.

