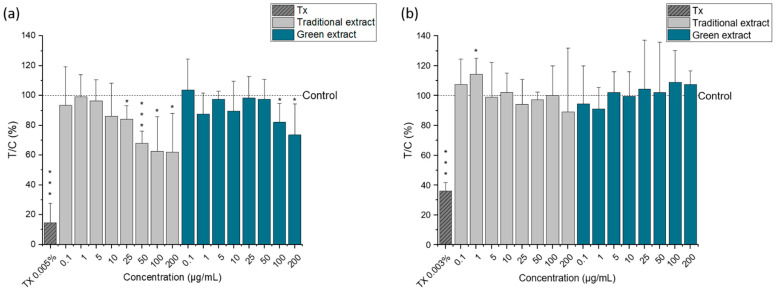
Figure 4.
Cell viability of HCT-116 cells (a) and HCEC-1CT (b) after 24 h incubation with different concentrations of the omega-3 lipid extracts produced by the traditional method (traditional extract) and the green method by using Saczyme (green extract) measured by SRB assay. Triton X (Tx; 0.005 or 0.003%) was used as positive control. Results are presented as mean + SD normalized to DMSO solvent control (0.5%; T/C in %) (n = 5). Statistical differences compared to the DMSO solvent control were calculated with a one-sample Student’s t-test (* p, *** p < 0.05, 0.01, 0.001). Significant differences among the test concentrations were calculated with one-way ANOVA (p < 0.05, a–c).

