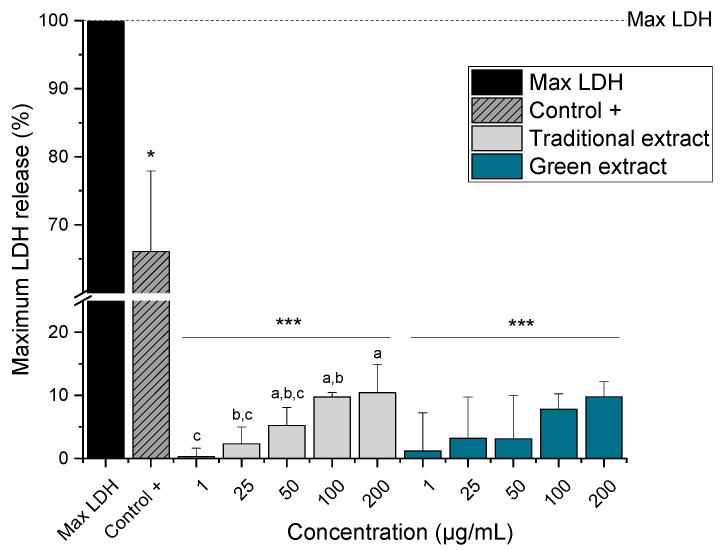
Figure 5.
Release of lactate dehydrogenase (LDH) from HCT-116 cells after 24 h incubation with different concentrations of the omega-3 lipid extracts produced by the traditional method (traditional extract) and the green method by using Saczyme (green extract). LDH positive control (control +) used was provided by the kit. Maximum LDH release was determined by lysing the cells by using Triton-X100 for 45 min. Results are presented as mean + SD normalized to the maximum LDH (n = 3). Statistical differences compared to the maximum LDH were calculated with a one-sample Student’s t-test (* p, *** p < 0.05, 0.01, 0.001). Significant differences among the test concentrations were calculated with one-way ANOVA (p < 0.05, a–c).

