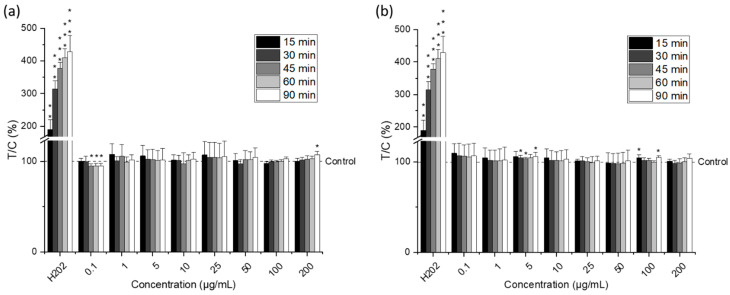
Figure 6.
ROS levels in HCT-116 cells after different incubation times (15, 30, 45, 60, and 90 min) with different concentrations of the omega-3 lipid extracts produced by the traditional method (a) and the green method by using Saczyme (b) measured by the dichlorofluorescein (DCF) assay. Hydrogen peroxide (H2O2) was used as positive control. Results are presented as mean + SD normalized to DMSO solvent control (0.5%; T/C in %) (n = 6). Statistical differences compared to the DMSO solvent control were calculated with a one-sample Student’s t-test (* p, ** p, *** p < 0.05, 0.01, 0.001).

