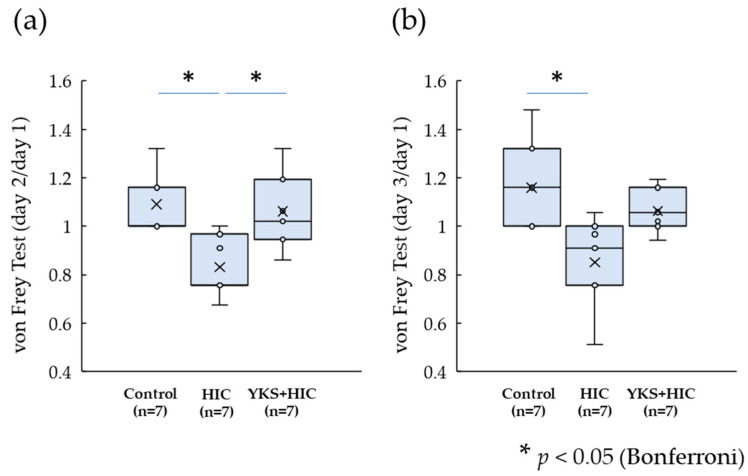
Figure 3.
Von Frey Test. The values obtained on day 2 (a) and day 3 (b) are shown by the rate of change in relation to a baseline value of 1. Horizontal lines within boxes denote median values, and x marks denote the mean values. * Significant difference (p < 0.05) (Kruskal–Wallis test with post hoc test and Bonferroni correction). HIC, Hunner-type interstitial cystitis; YKS, Yokukansan.

