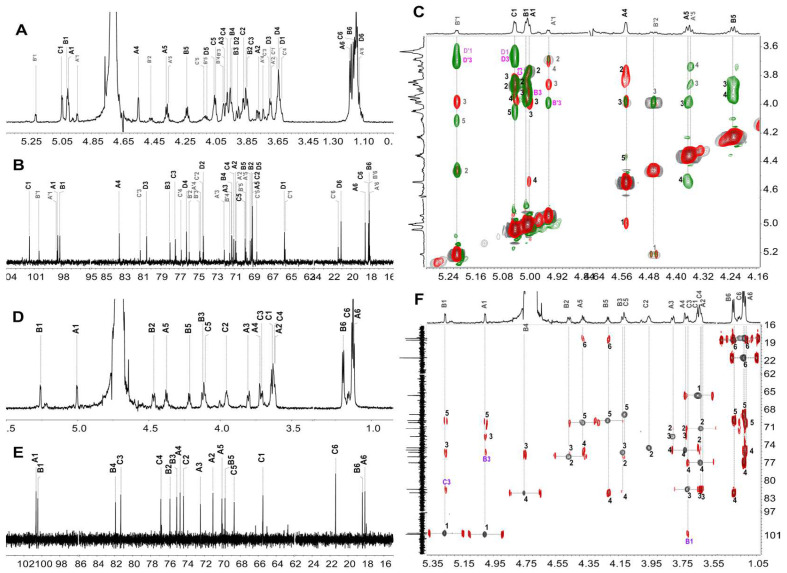
Figure 6.
1D/2D NMR spectra of F3-a and F3-b. (A), 1H NMR spectrum of F3-a. (B), 13C NMR spectrum of F3-a. (C), part of the overlapped spectra of 1H-1H COSY (gray), TOCSY (red), and ROESY (green) of F3-a. (D), 1H NMR spectrum of F3-b. (E), 13C NMR spectrum of F3-b. (F), overlapped spectra of 1H-13C HSQC (gray) and HMBC (red) of F3-b.

