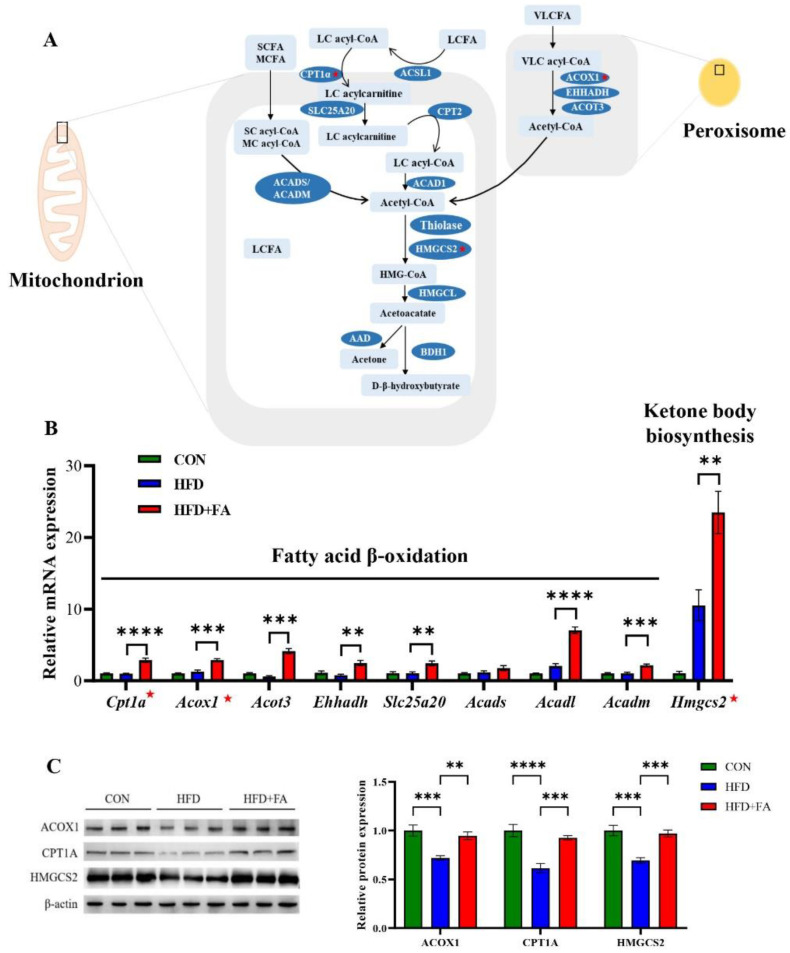
Figure 4.
FA increased fatty acid oxidation and ketone body biosynthesis in liver. (A) Schematic representation of fatty acid oxidation and ketone body biosynthesis pathways. ★: the rate-limiting enzyme. (B) The relative mRNA levels of genes involved in fatty acid oxidation and ketone body biosynthesis in the livers of the CON, HFD and HFD+FA mice (n = 6). (C) The relative protein levels of CPT1α, ACOX1, and HMGCS2 (n = 3). Data are shown as mean ± SEM. ** p < 0.01, *** p < 0.001, **** p < 0.0001.

