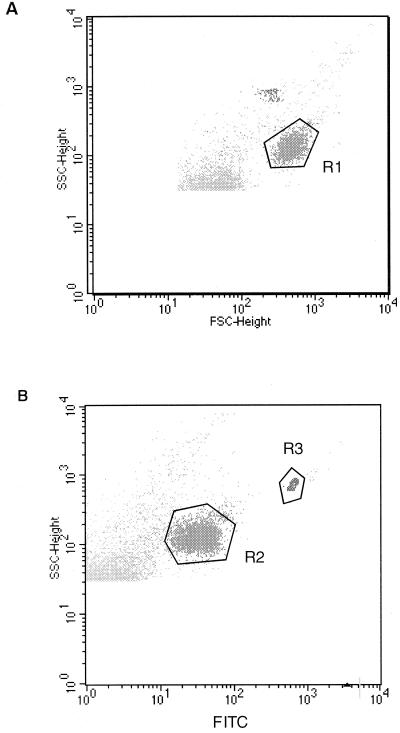
FIG. 1.
Flow cytometric detection of C. parvum oocysts. Graphs show profiles from a representative experiment with a purified oocyst suspension. (A) A flow cytometric region (R1) was defined according to the parameters of size (FSC-height) and internal complexity (SSC-height). (B) Region R2 represents the corresponding fluorescence profile after labeling with FITC-conjugated MAb for Cryptosporidium oocyst wall. Region R3 includes fluorescent beads used as an internal standard for oocyst counting.

