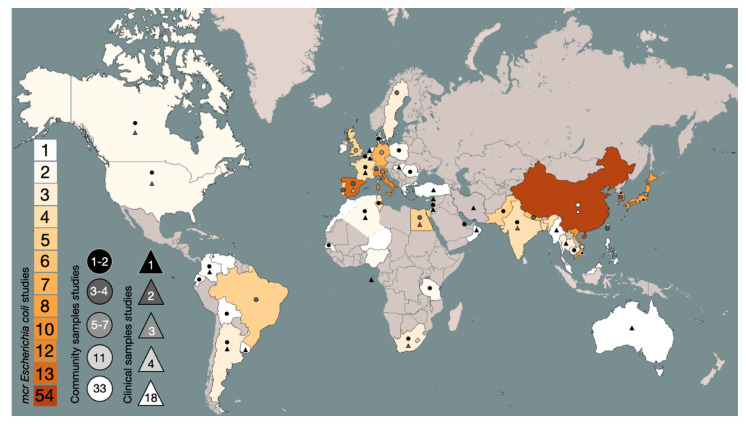
Figure 2.
Global spread of mcr genes in E. coli. The countries colored from red-orange to yellow plus white represent the total number of studies for those countries according to the key to the lower left, while the countries in gray are without studies. The triangles in the black-to-white scale represent the number of studies with community samples (healthy humans, pigs, and/or chickens). The circles in the black-to-white scale represent the number of studies with clinical samples.

