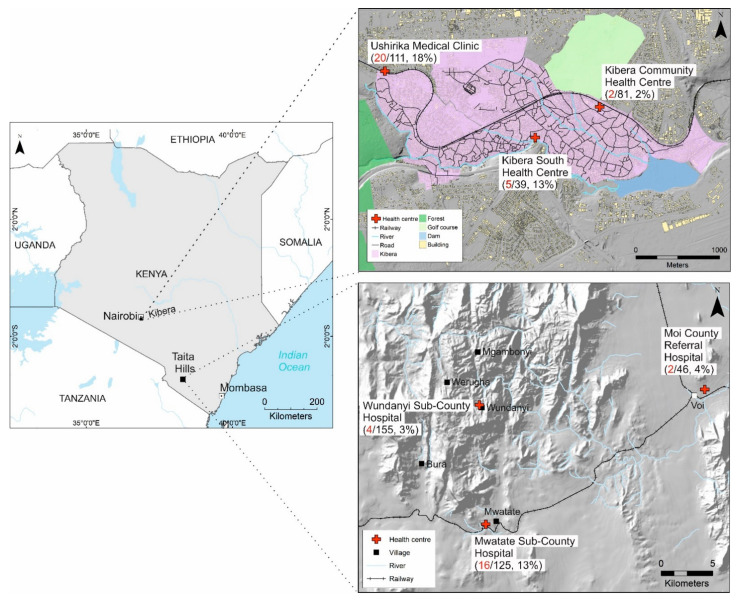
Figure 1.
A map of Kenya showing the study sites in Taita-Taveta County and Kibera slum, Nairobi. Indicated alongside the site names is the number of samples per site (denominator) and prevalence of chikungunya IgG antibodies by immunofluorescence assay (red text and percentage). Geographic information system (GIS) data for Kibera was obtained from Kounkuey Design Initiative [34]. Hillshade for Kibera was created in GIS software from digital elevation model (DEM) 5 m and for Taita-Taveta, hillshade was created from DEM 20 m [35].

