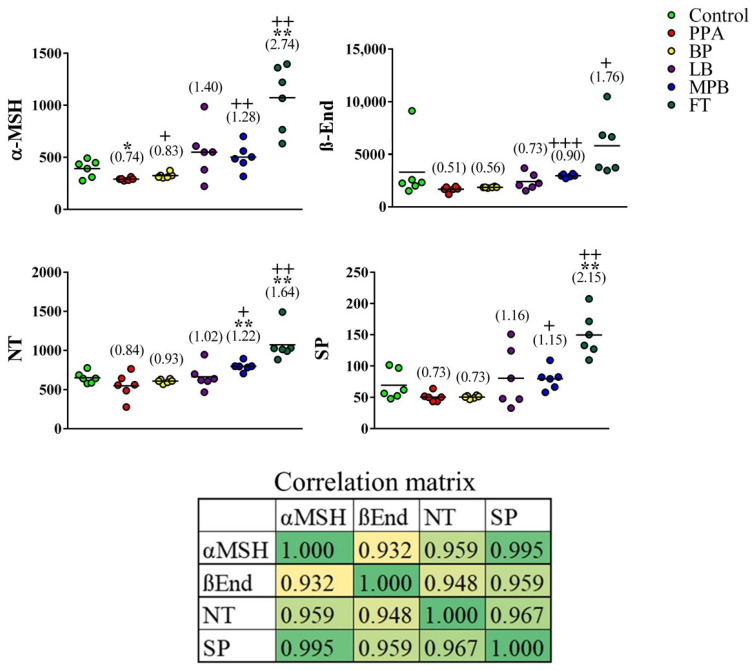
Figure 1.
Effects of bee pollen and probiotic intestinal microbiota on neuropeptide levels in a rat model of autism. Unpaired t-test was used to test the significance of differences between the control group and each of the remaining groups. Corresponding p values of <0.05 and <0.005 are indicated by “*” and “**”, respectively. Differences between the PPA group and each of the other non-control groups were similarly tested, and corresponding p values of <0.05, <0.005, and <0.0005 are indicated by “+”, “++”, and “+++”, respectively. Fold change relative to controls is indicated in parentheses. PPA: propionic acid; BP: bee pollen; LB: Lactobacillus; MPB: mixed probiotic bacteria; FT: fecal transplant. The correlation matrix shows correlations between the neuropeptide levels (bottom). Correlation was calculated using Pearson product–moment correlation analysis. The heatmap shows r values. The p values associated with r at 95% confidence interval are 0.007, 0.002, 0.00004, 0.004, 0.00249, and 0.00158 for α-MSH/β-End, α-MSH/NT, α-MSH/SP, β-End/NT, β-End/SP, and NT/SP, respectively.

