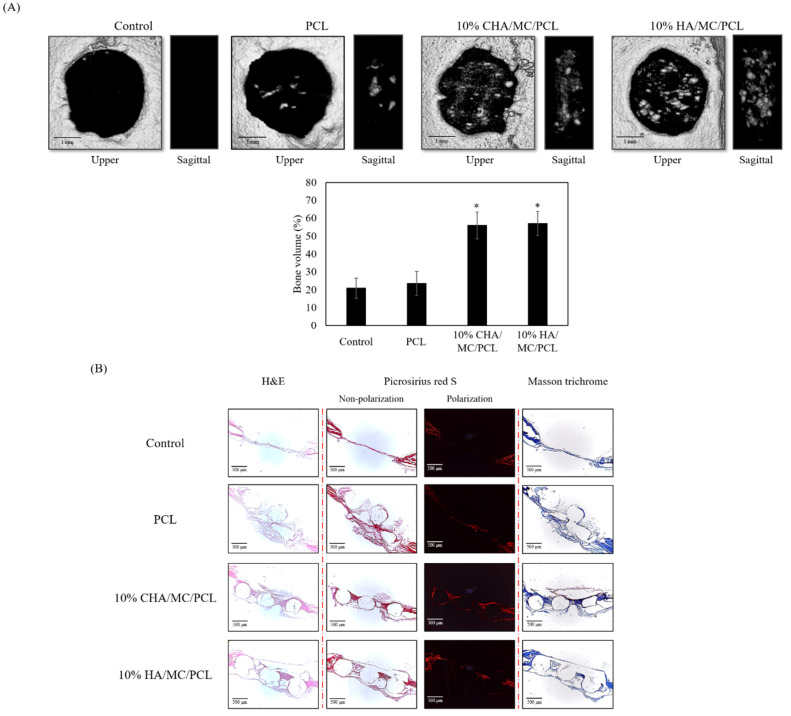
Figure 6.
In vivo performance evaluation. (A) 3D reconstruction images of bone defect areas and (B) histological analysis of the effect of scaffolds on bone regeneration in vivo. Note: “S” represents scaffold; “black arrow” indicates new bone; “white arrow” indicates new type I collage. * p < 0.05 was considered to indicate a statistically significant difference compared with PCL group.

