Figure 1.
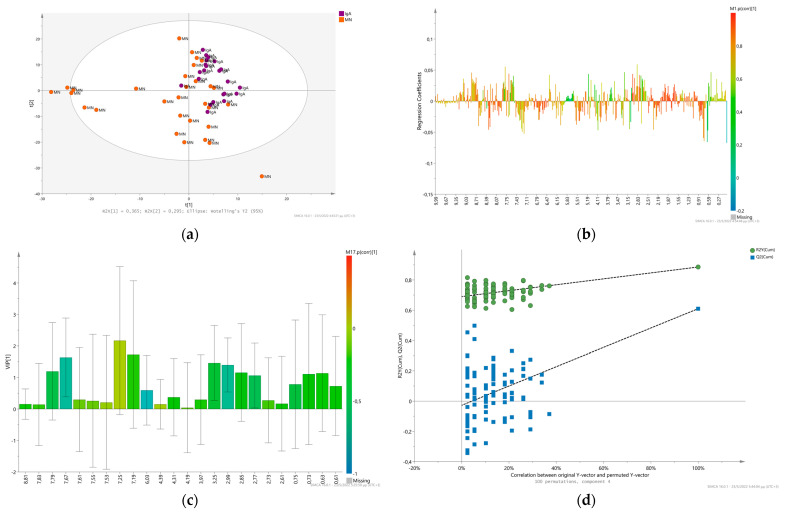
Multivariate analysis of 1H 1D NMR urine spectra of patients with the two highly occurring etiologies, IgAN (purple spheres) and MN (orange spheres). (a) PLS-DA scores plot of the IgAN and MN glomerulonephritis. (b) PLS-DA Coefficients’ plot of the comparison between the CPMG urine spectral data of IgAN and MN glomerulonephritis. (c) PLS-DA VIP scores first 25 in sort descending order of urine glomerulonephritis metabolomes colored according to their presenting correlation and contribution coefficients “p(corr)” at the first latent component VIP [1]. (d) Permutation plot of the PLS-DA model validating the statistical significance of the model as the permuted R2 (green cycles) and Q2 (blue squares) are lower than the original values of R2 and Q2.

