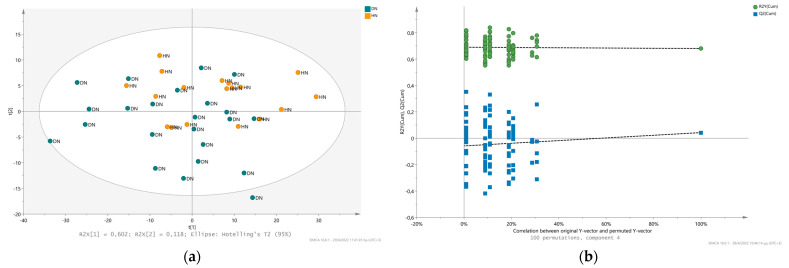
Figure 4.
Urinary metabolic fingerprint Hypertensive Nephrosclerosis (HN) and Diabetic Nephropathy (DN): (a) PLS-DA 2D scores plot of 1H 1D NOESY data matrix showing the clustering between HN (orange spheres) and DN (blue spheres) urine fingerprint; (b) Permutation plot of the PLS-DA model validating the statistical significance of the model as the permuted R2 (green cycles) and Q2 (blue squares) are lower than the original values of R2 and Q2.

