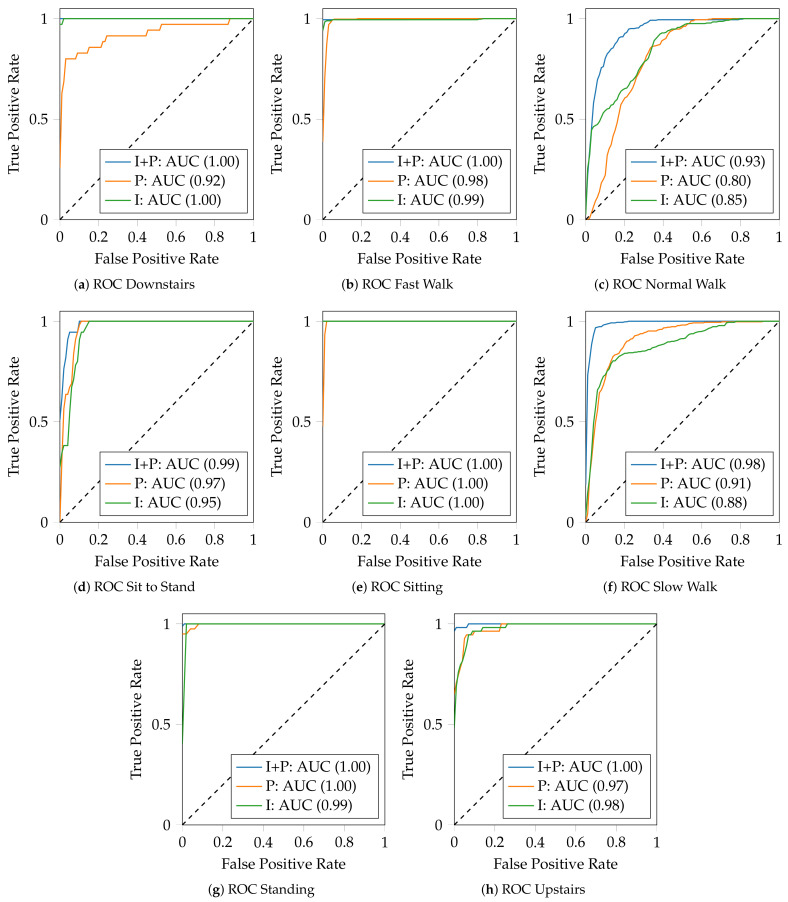
Figure 3.
Evaluation of ROC curves for each activity using three different datasets built from different types of sensors: Inertial sensors and pressure sensors (I + P), pressure sensors (P), and inertial sensors (I). In (e), since the sitting activity is correctly classified in all the experiments, the curve “I+P: AUC (1.00)” overlaps “I: AUC (1.00)” and is not visible.

