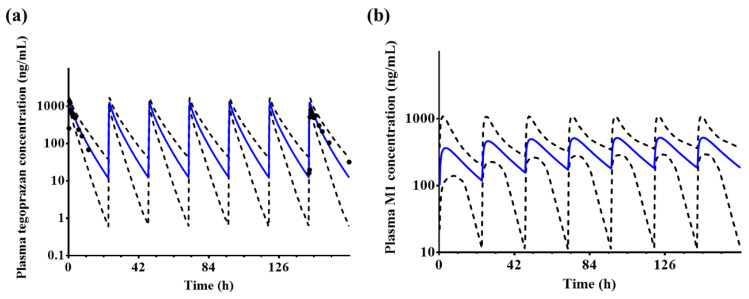
Figure 4.
Predicted plasma (a) tegoprazan and (b) M1 concentration–time profiles after the repeated administration of 100 mg tegoprazan once daily for 7 days. Blue solid lines and black dotted lines represent the mean predicted plasma concentrations and the 95th and 5th percentiles, respectively. Black dots represent the observed tegoprazan concentration profiles (n = 6). Only the predicted profiles are presented for M1.

