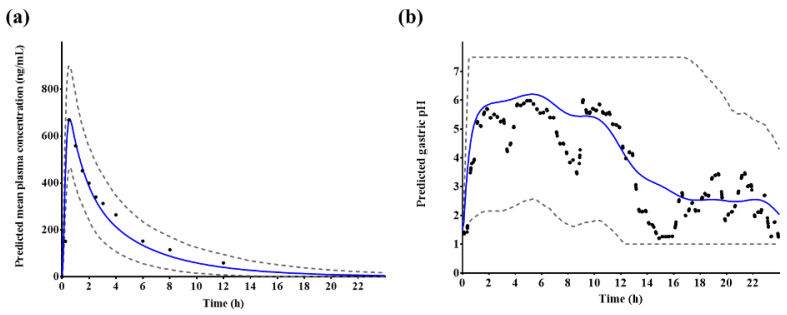
Figure 5.
Predicted (a) plasma tegoprazan concentration and (b) gastric acid pH–time profiles after a single administrations of 50 mg tegoprazan. Blue solid lines represent the predicted mean values, gray dotted lines represent the predicted 5th and 95th percentile, and black dots represent the observed plasma tegoprazan concentration or gastric acid pH profiles, respectively.

