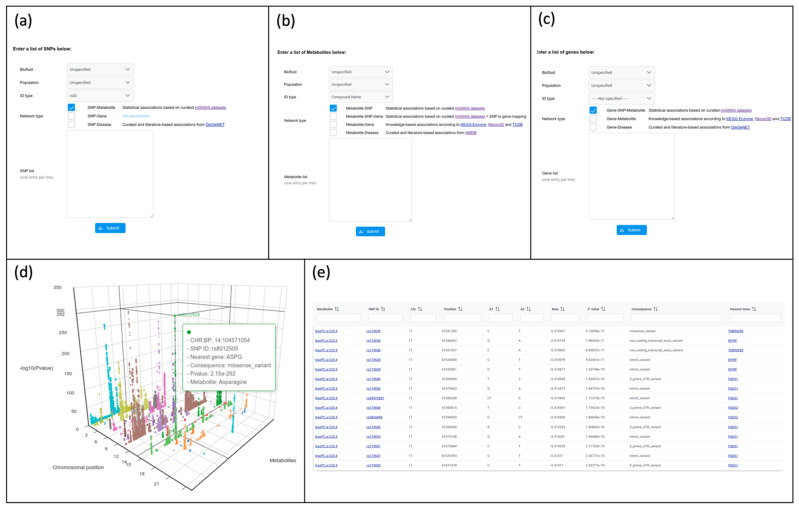
Figure 2.
Screenshots of upload pages for SNP (a), metabolite (b), and gene (c) modules. (d) A screenshot of a 3D Manhattan plot from the ‘Browse’ module based on the data from Lotta et al. [7]. The x-axis is the position of the SNPs, and the y-axis represents different metabolites, while the z-axis corresponds to the significance of the association; (e) a screenshot showing the table view in the ‘Browse’ module.

