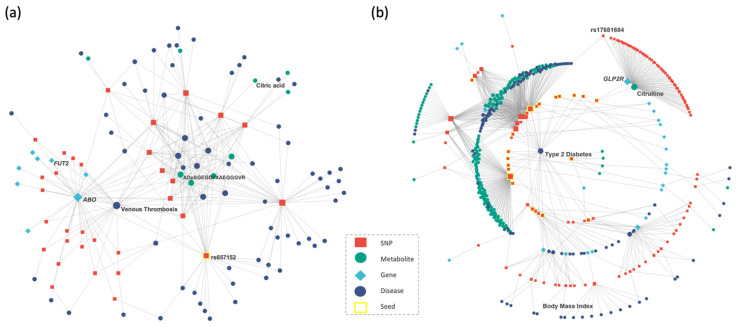
Figure 3.
Screenshots of network results for the (a) COVID-19 case study and (b) type 2 diabetes case study. Each node represents either a SNP (orange square), a metabolite (green circle), a gene (blue diamond), a disease (dark blue circle), or a seed node (yellow square outline). Each edge is either an association between one SNP and one metabolite, an association between one SNP and one disease, a positional mapping of SNP to gene, or a protein–protein interaction. The size of a node is proportional to the number of other nodes connected to it.

