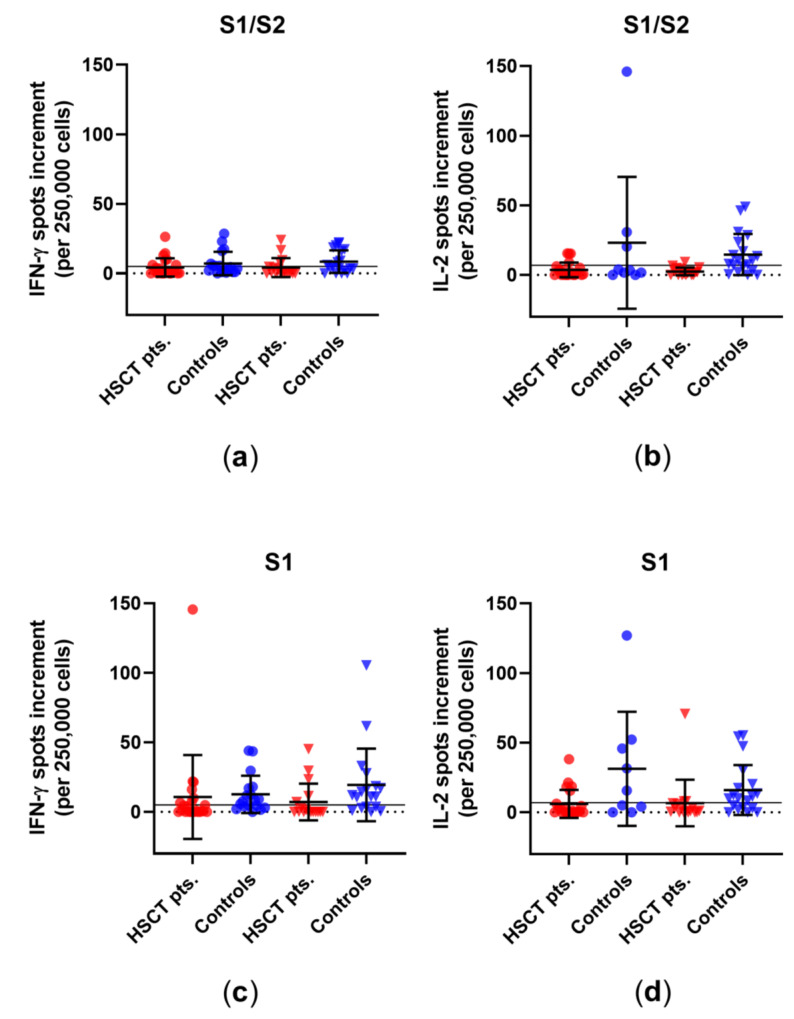
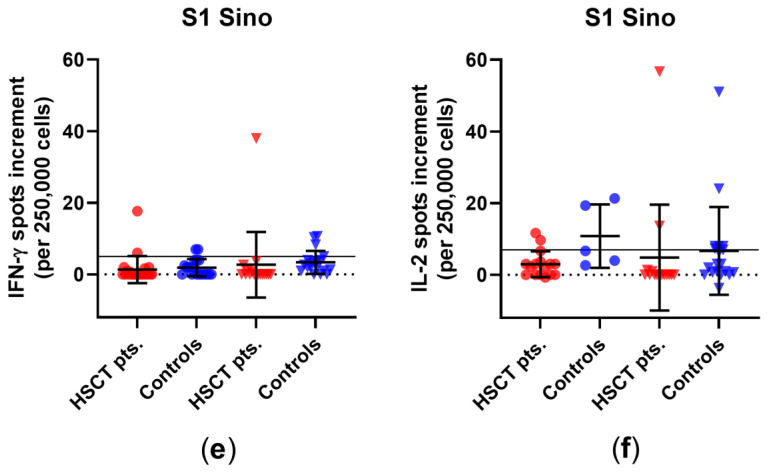
Figure 2.
SARS-CoV-2-specific ELISpot responses in HSCT patients and healthy controls before and after third vaccination. Distribution of (a) IFN-γ and (b) IL-2 ELISpot responses upon stimulation with an S1/S2 peptide mix. Distribution of (c) IFN-γ and (d) IL-2 ELISpot responses upon stimulation with an S1 peptide mix. Distribution of (e) IFN-γ and (f) IL-2 ELISpot responses upon stimulation with S1 Sino. Please note that the scales differ. Circles indicate data before the third vaccination (red—HSCT, blue—healthy controls), while triangles indicate data after the third vaccination. Responses were compared by two-tailed Mann–Whitney test. Horizontal lines indicate mean values, while error bars indicate the standard deviation. The dotted line represents the zero line. The black horizontal line indicates the cutoff.


