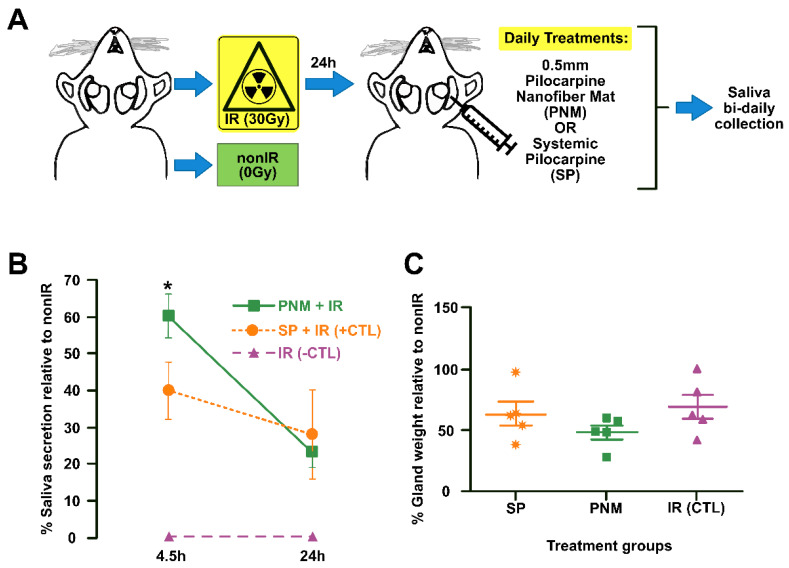
Figure 6.
Schematic drawing of the in vivo salivary glands hypofunction model (A), one day saliva secretion rate after administration of the pilocarpine nanofiber mats (PNM) and the orally administrated systemic pilocarpine (SP) (B) and salivary gland weight remained unchanged PNM administration (C). Error bars represent SEM from n = 4−5. * p < 0.05 when compared to irradiated group with systemic pilocarpine only (SP, which represents the positive CTL). IR: irradiated (negative CTL). nonIR: non-irradiated control group. SGs: salivary glands. Adapted from [92].

