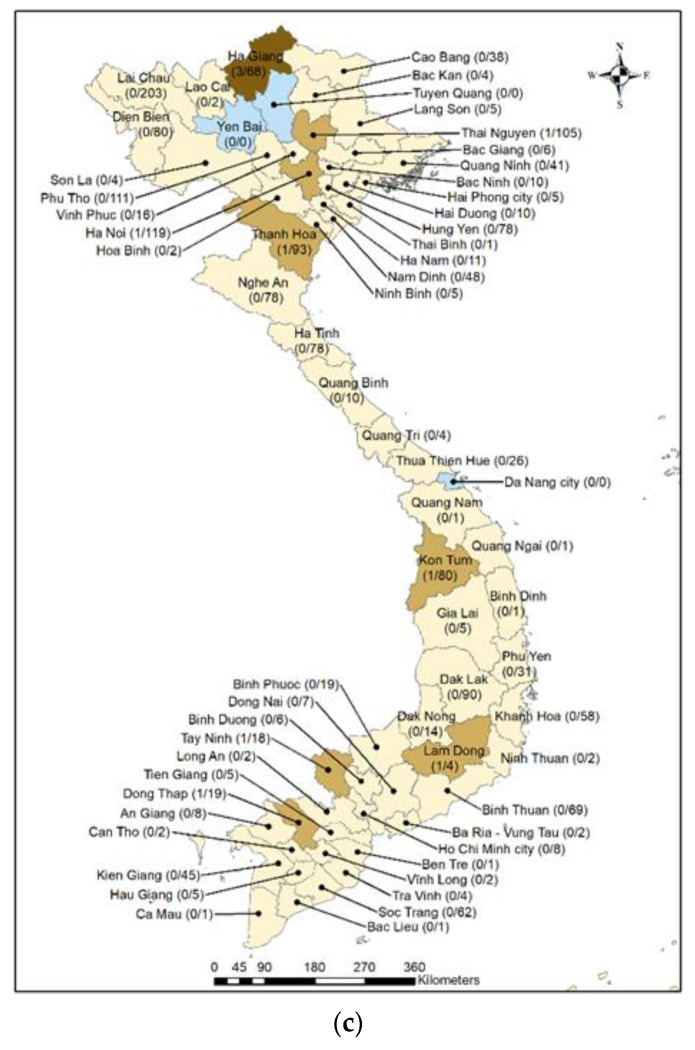
Figure 4.
Distribution of confirmed cases of: (a) Scrub Typhus, n = 484; (b) Murine Typhus, n = 67; and (c) Spotted Fever, n = 10 (c) by provinces. The color density corresponds to the number of confirmed cases: the darker the color, the higher the number of confirmed cases. The fraction shows the number of confirmed case (numerator) and the number of recruited patients (denominator) for each province.


