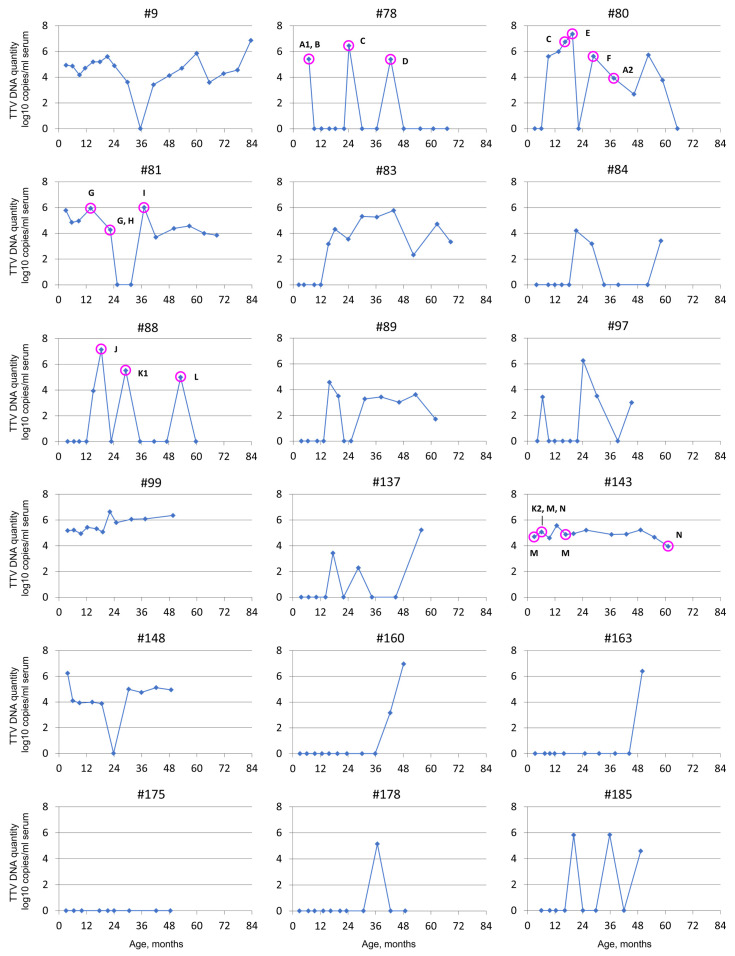
Figure 3.
Serum TTV DNA quantity fluctuations in children (n = 18) followed up for 4 to 7 years. The TTV strains present in a total of 17 selected samples (indicated with purple rings) of five children were further analyzed with multiplex PCR and sequencing. The different TTV strains are labeled with different letters to facilitate easy differentiation of the types in the figure. NB, the letters are in alphabetical order and do not correlate with any ICTV or other classifications. A1 and A2 types are, on the nucleotide level, 95.2–96.1% similar to each other, and K1 and K2 are 95.0–95.2% similar. Type N is 90.5–90.9% similar to K1 and 88.3–88.6% similar to K2, and therefore defined as a different strain. Other strains are 75% or less similar to each other. See Figure 4, phylogenetic tree, for more information.

