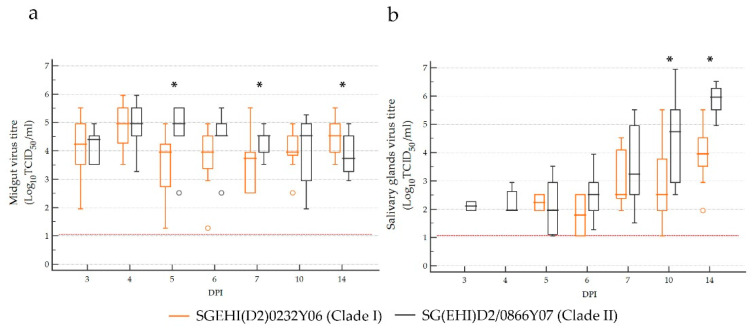
Figure 6.
Ae. aegypti midgut (a) and salivary gland (b) virus titers at different timepoints following oral infection with clade I and II isolates. The central box represents the values from the lower to upper quartile (25 to 75 percentile). The middle line represents the median. The horizontal line extends from the minimum to the maximum value, excluding far-out values, which are displayed as separate points. Asterisks indicates a p-value of <0.05 by the Mann–Whitney U test between the two clades. The limit of detection is represented by the red dotted line.

