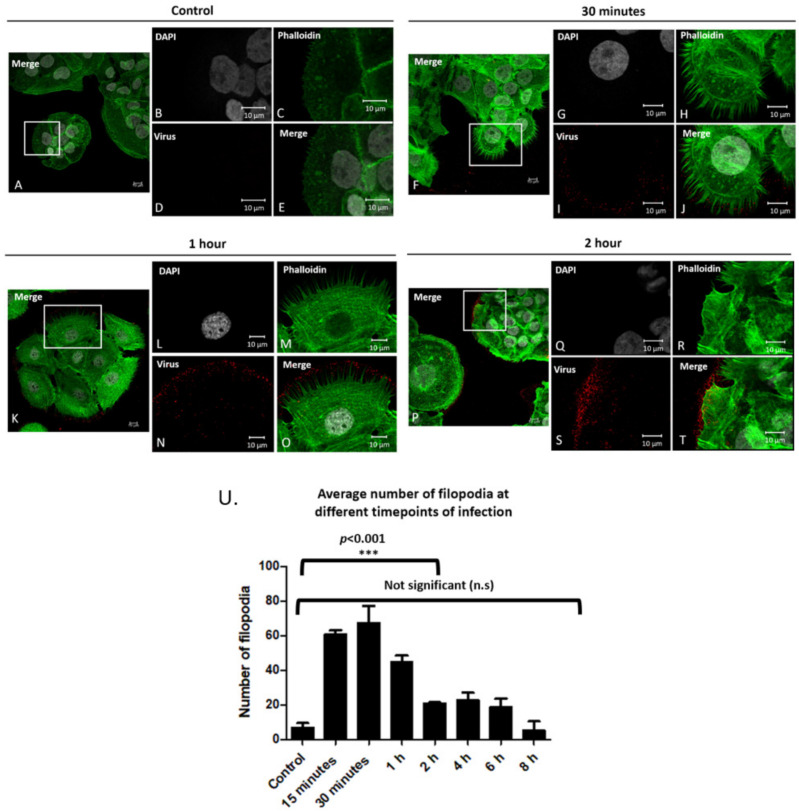
Figure 1.
Filopodia numbers increase after the addition of PsVs. Confocal microscopy images of control cells without PsVs addition (A–E), and after PsV addition for 30 min (F–J), 1 h (K–O), and 2 h (P–T). Cell nuclei were stained with DAPI (grey), phalloidin stained filopodia (green), and H16.V5 antibody stained HPV16 L1 protein (red). Full merged images of all channels (A,F,K,P). Zoomed in images of merged images (E,J,O,T). Average number of filopodia per cell after viral addition for 15 min–8 h (U). Filopodia were counted using LAS X Life Science Microscope Software Platform for fifteen cells at each timepoint for three separate experiments (n = 45). Images are shown in X, Y, Z planed Z stacks. An ANOVA Dunnett’s multiple comparisons test was used to evaluate statistical significance (samples were compared to control cells, ***, p < 0.001). Averages are displayed with SEM.

