Figure 9.

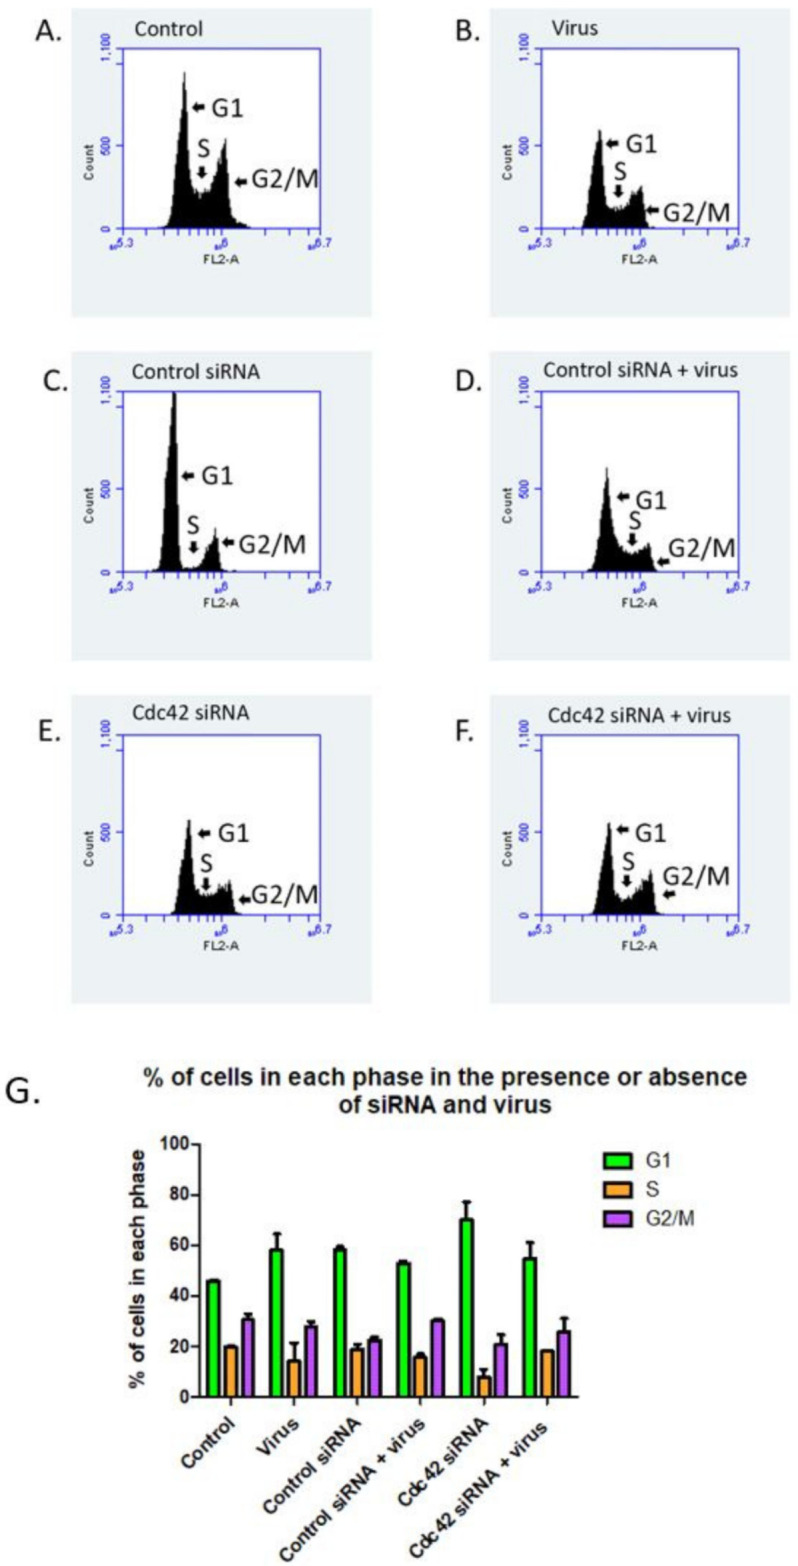
Cells treated with Cdc42 siRNA undergo cell cycle arrest in the presence and absence of virus. Histograms showing the percentage of cells in different stages of the cell cycle based on DNA content examined by propidium iodine staining via flow cytometry (A–F). Control cells not treated with virus or siRNA (A), cells treated with virus (B), cells treated with control siRNA (C), cells treated with both control siRNA and virus (D), cells treated with Cdc42 siRNA (E), and cells treated with both Cdc42 siRNA and virus (F). Graphic representation of the percentage of cells in each stage of the cell cycle after each treatment (G), n = 3. Cells were treated with control or Cdc42 siRNA for 48 h prior to virus addition. Virus was permitted to bind to cells for 2 h on ice with remaining virus removed with PBS washes. Flow cytometry was performed 48 h after viral addition.
