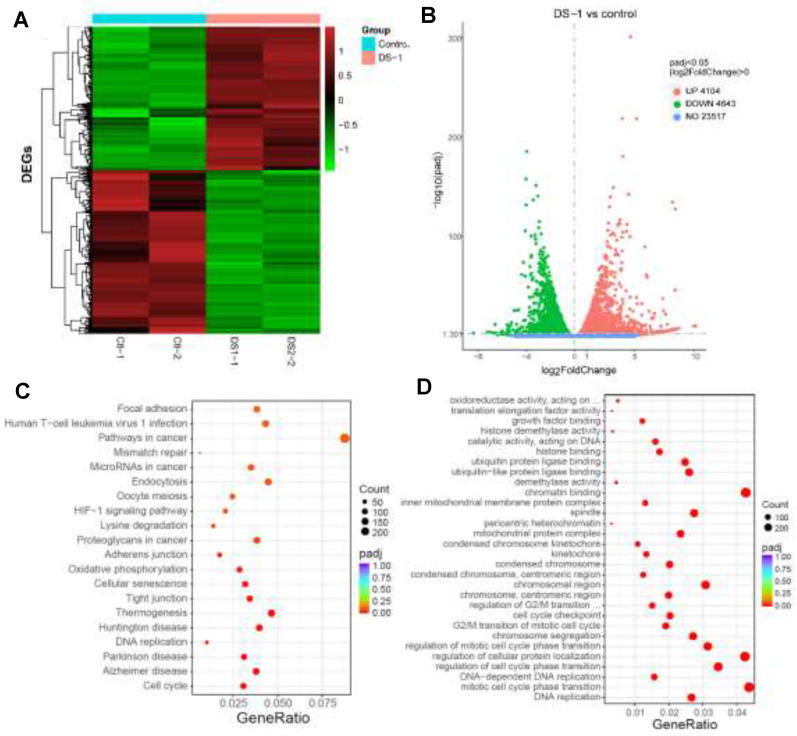
Figure 4.
RNA-seq gene expression analyses of U−2 OS cells with/without DS−1 (6.25 µM). (A) Heatmap of detected genes differentially expressed in the control group and DS−1 group. (B) Volcano map of detected genes differentially expressed in the control group and DS−1 group. (C) Kyoto Encyclopedia of Genes and Genomes (KEGG) analysis of differentially expressed genes. (D) Gene Ontology (GO) term analysis of differentially expressed genes is shown in the scatter plots.

