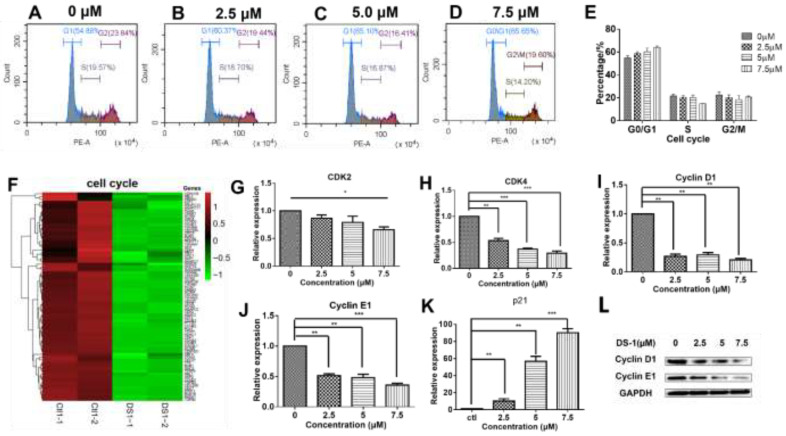
Figure 5.
DS−1 regulated the cell cycle of U−2 OS cells. (A–D) Cell cycle of U−2 OS cells was retained in the G0/G1 phase. U−2 OS cells were treated with DS−1 at 0, 2.5, 5.0, and 7.5 µM for 24 h, and the cell cycle ratio was measured by flow cytometry; the cell cycle distribution is shown in Table 2. (E) Histogram of cell cycle distribution after U−2 OS cells were treated with DS−1. (F) Heatmap of the expression of genes relating to cell cycle in the transcriptome results. (G–K) In U−2 OS cells treated with DS−1 at concentrations of 0, 2.5, 5.0, and 7.5 μM, RNA was extracted and analyzed by RT-PCR, and the changes in CDK2, cyclin D1, cyclin E1, and p21 mRNA are presented in the histogram. (L) Cyclin D1 and cyclin E1 protein relative expression was analyzed by Western blot. Values are the average of three independent experiments, * p < 0.05, ** p < 0.01, *** p < 0.005.

