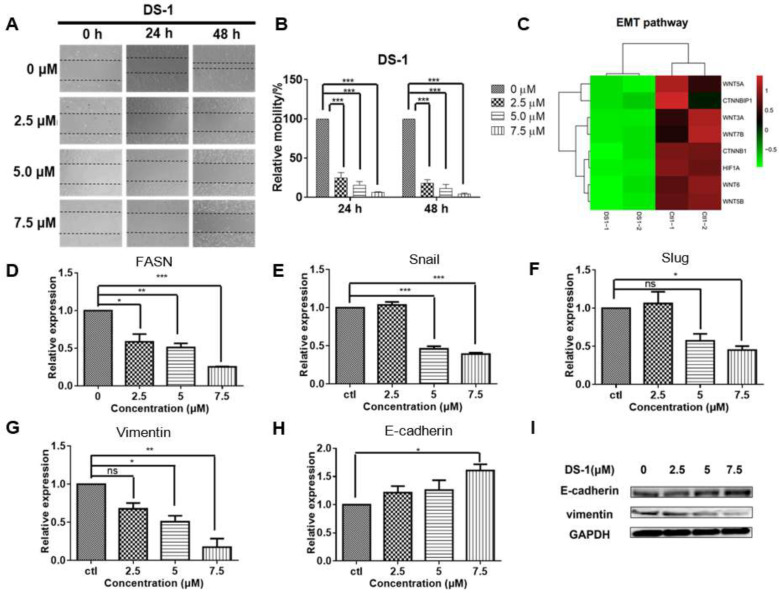
Figure 6.
DS−1 inhibited cell migration of U−2 OS cells. (A,B) U−2 OS cells were cultured to the logarithmic growth phase; the cell monolayers were scratched by pipet tips, and DS−1 at 0, 2.5, 5, and 7.5 µM was added to the plate for 24 and 48 h, respectively. Cell migration was recorded at the same location of the scratch. Data of relative mobility are shown as the mean ± S.D. from three independent experiments. *** p < 0.005. (C) The expressions of several genes regulating EMT signals from the transcriptome result are shown in the heatmap. (D–H) U−2 OS cells were treated with DS−1 at 2.5, 5.0, and 7.5 µM for 24 h, and the relative expression of FASN, snail, slug, vimentin, and E-cadherin mRNA are shown in histograms. Values are the average of three independent experiments; * p < 0.05, ** p < 0.01, *** p < 0.005. (I) EMT marker molecules E-cadherin and vimentin were analyzed by Western blot.

