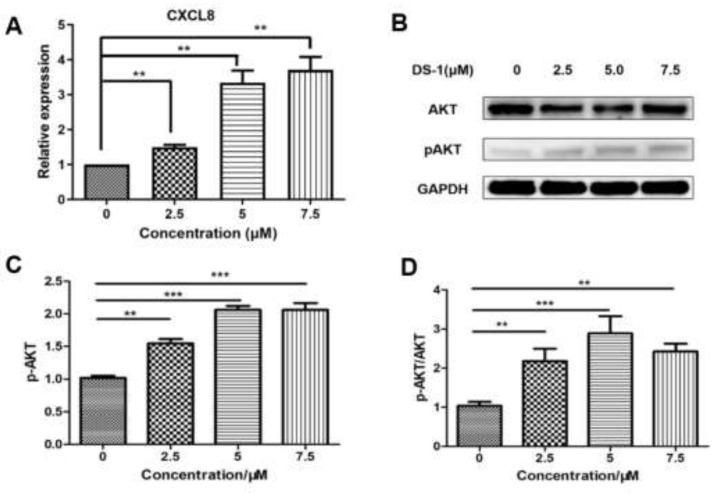
Figure 9.
DS−1 induced upregulation of AKT phosphorylation in U−2 OS cells. (A) U−2OS cells were treated with DS−1 at 0, 2.5, 5, and 7.5 µM for 24 h, and the change in CXCL8 mRNA was analyzed by RT-PCR and is presented in the histogram. (B) U−2 OS cells were treated with DS−1 at 0, 2.5, 5, and 7.5 µM for 24 h, and proteins AKT and p-AKT were analyzed by Western blot. (C) The result of the Western blot was calculated by Image J and shown in the histogram. (D) The p-AKT/AKT value is shown in the histogram. Values are the average of three independent experiments, ** p < 0.01, *** p < 0.005.

