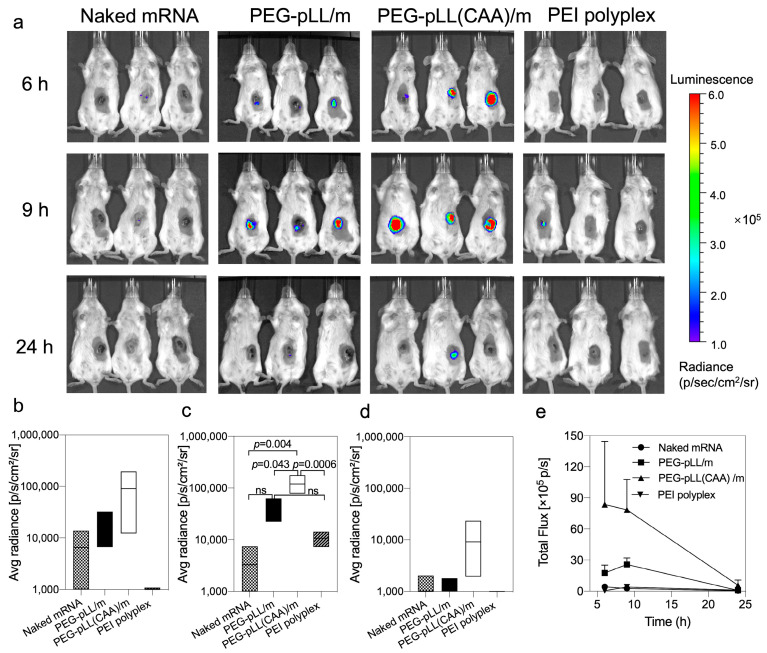
Figure 4.
In vivo transfection of micelles. (a) Representative bioluminescence images following in vivo delivery of fluc mRNA in CT26 tumor-bearing mice. Mice were intratumorally injected with naked fluc mRNA, fluc mRNA-loaded PEG-pLL/m, fluc mRNA-loaded PEG-pLL(CAA)/m and PEI fluc mRNA polyplexes (5 μg mRNA per mouse, n = 3), and imaged at 6, 9 and 24 h post-injection. Quantification of luminescence signals from IVIS images at (b) 6 h, (c) 9 h and (d) 24 h post-injection. Data were expressed as the mean ± s.d. (n = 3). Statistical significance was calculated by the one-way ANOVA test. ns means not significant. (e) Quantification analysis of luminescent signals at indicated time points.

