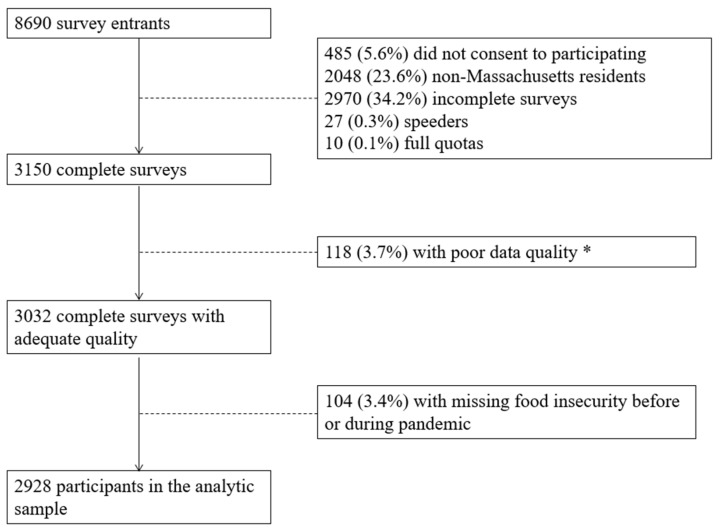
Figure A1.
Study flow diagram. * Poor data quality was defined as having non-sensical free-text responses, age below 18 or above 100, survey response information which differed greatly from the Qualtrics demographic information, or more than two data flags (e.g., respondent’s age does not match household composition, reported diaper insecurity without children in household, use of school meals program or WIC without children in household, reported using food pantry but state none of their groceries come from pantry, reported using some form of pandemic food assistance generally but reported not using any specific food assistance program).

