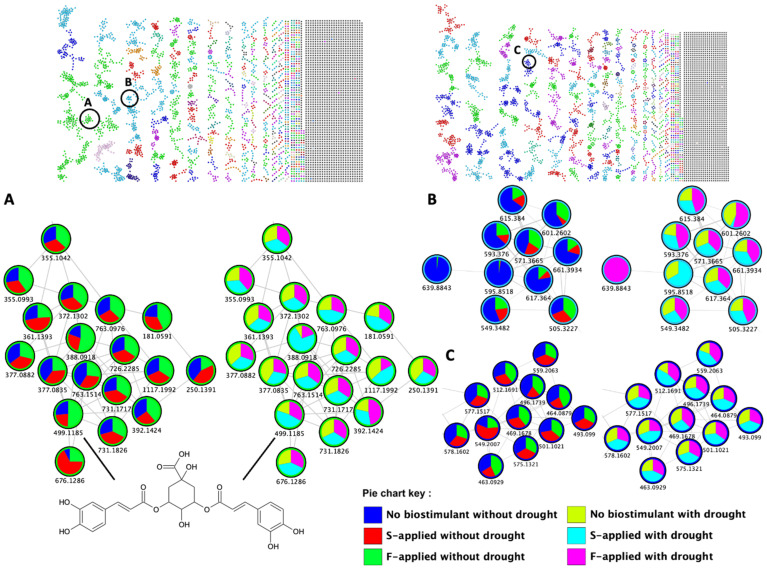
Figure 6.
The MolNetEnhancer molecular network of positive electrospray ionization (ESI+) (top left) and negative ESI- MS/MS (top right) spectra obtained from maize leave extracts. The enriched molecular networks depict structurally similar nodes as molecular families/clusters, with the annotated metabolites, MS2LDA substructures and NAP annotations assigned class annotations, represented by colored nodes and nodes with no class annotation as grey. The pie charts show the differential effects of the seaweed-based biostimulant treatment and their method of application on the metabolite levels of the (A) carboxylic acid and derivatives; (B) lipids; and (C) flavonoid molecular families under normal and drought stress conditions. Abbreviations: S-applied, soil applied; and F-applied, foliar applied.

