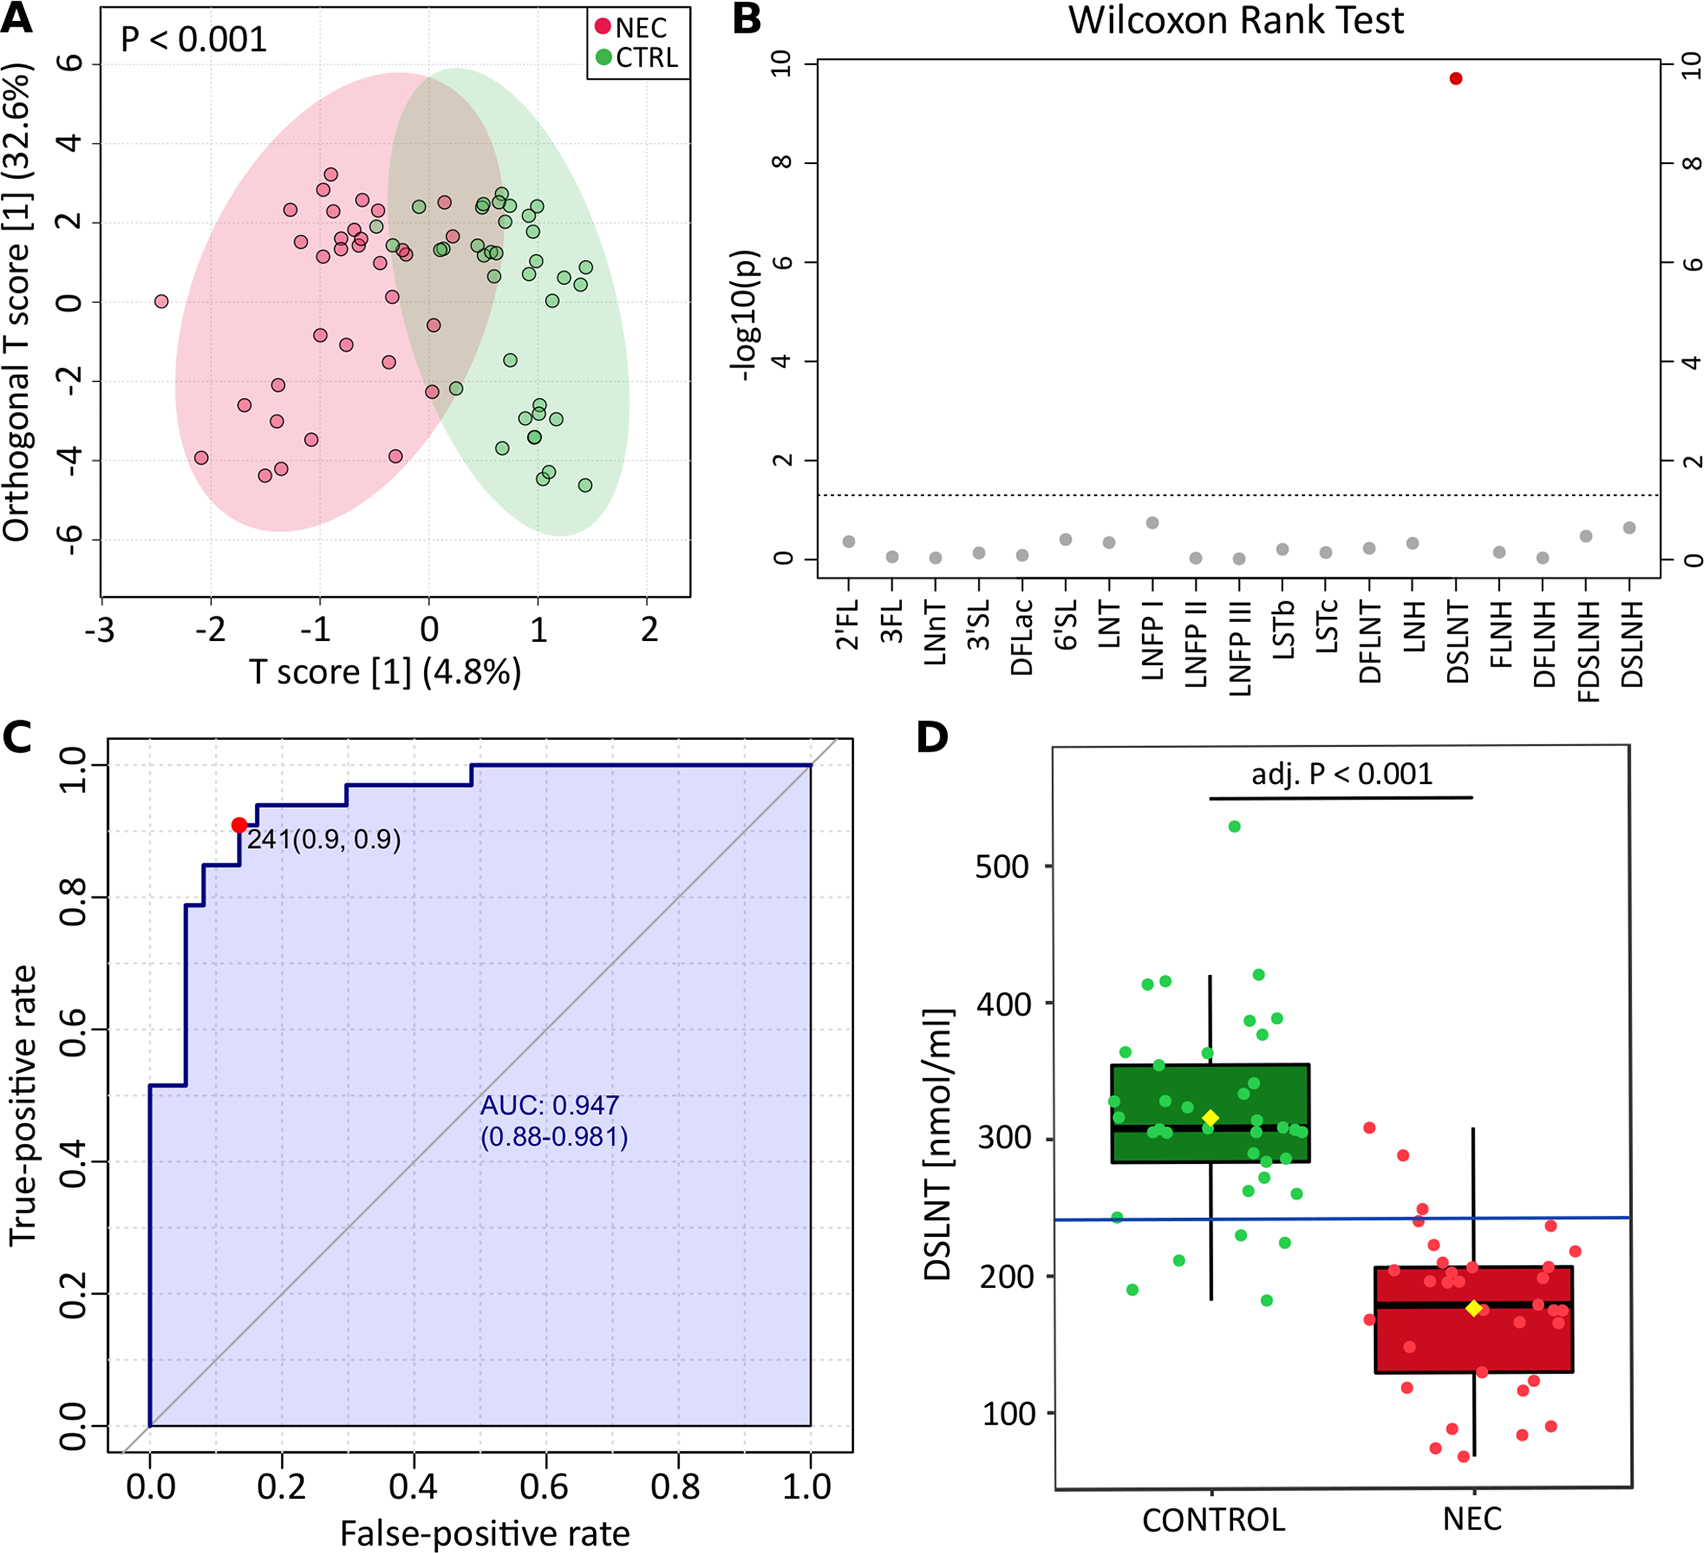
Figure 1.

Analysis of HMO profiles and DSLNT concentration in NEC and CTRLs. (A) Orthogonal partial least squares discriminant analysis of maternal HMO profiles fed to infants diagnosed with NEC and CTRLs. The p value was calculated based on 2000 permutations. (B) Visual representation of p values obtained from comparison of individual HMOs between NEC and CTRL groups. Wilcoxon rank-sum test was applied, and p values were adjusted with the false discovery rate algorithm. The line indicates p value=0.05. (C) Univariate receiver operating characteristic curve generated on DSLNT concentration identified 241 nmol/mL as the best threshold for NEC prediction. The performance of the classification is defined by the AUC, specificity (false-positive rate) and sensitivity (true-positive rate). (D), Box plot showing the concentration of DSLNT between NEC and controls. Blue line represents the 241 nmol/mL threshold. 2′-FL, 2′-fucosyllactose; 3′-FL, 3′-Fucosyllactose; 6′SL, 6′-Sialyllactose; adj, adjusted; AUC, area under the curve; CTRL, control; DFLac, difucosyllactose; DFLNH, difucosyllacto-N-hexaose; DFLNT, difucosyllacto-N-tetraose; DSLNH, disialyllacto-n-hexaose; DSLNT, disialyllacto-N-tetraose; FDSLNH, fucodisialyllacto-N-hexaose; FLNH, fucosyllacto-N-hexaose; HMO, human milk oligosaccharide; lacto-N- neotetraose, 3′-SL, 3′-sialyllactose; LNFP, lacto-N-fucopentaose; LNH, lacto-N-hexaose; LNnT; LNnT, lacto-N-neotetraose; LNT, lacto-N-tetraose; LST, sialyllacto-N-tetraose; NEC, necrotising enterocolitis.
