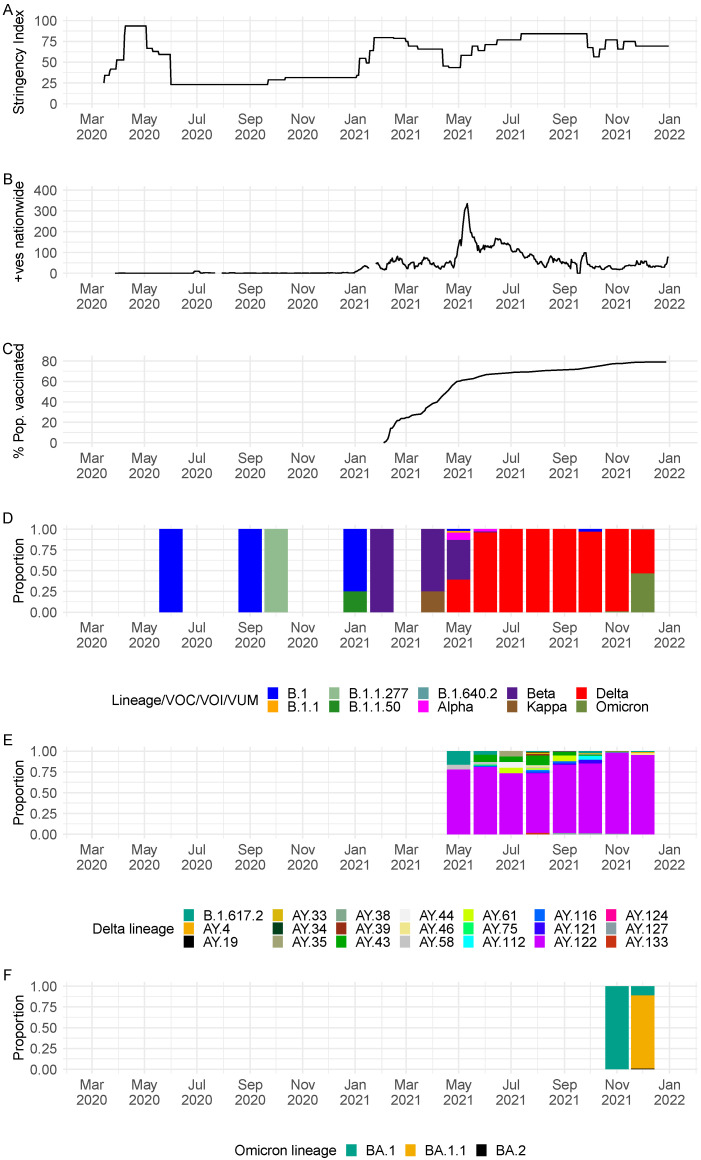
Figure 1.
(A) Seychelles government intervention levels as measured by the Oxford stringency index [15]. (B) An epidemic curve for Seychelles derived from the daily positive case numbers obtained from https://ourworldindata.org/coronavirus/country/seychelles (accessed on 5 May 2022). (C) Percentage of the population administered with vaccine; data obtained from https://ourworldindata.org/coronavirus/country/seychelles (accessed on 5 May 2022). (D) Monthly temporal pattern of SARS-CoV-2 lineages and variants in Seychelles among the 1056 samples sequenced from COVID-19 positive cases from the Seychelles (25 June 2020, to 31 December 2021). (E) Monthly temporal distribution of Delta VOC lineages among samples sequenced from COVID-19 positive cases from the Seychelles (25 June 2020, to 31 December 2021). (F) Monthly temporal distribution of Omicron VOC lineages among samples sequenced from COVID-19 positive cases from the Seychelles (25 June 2020, to 31 December 2021).

