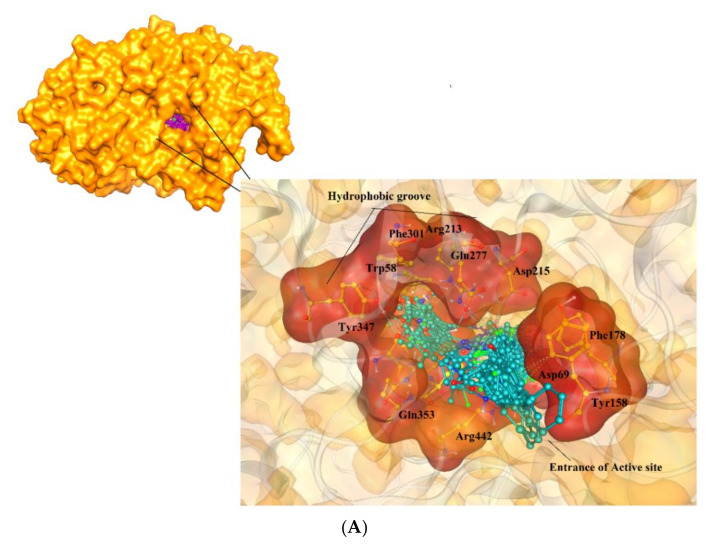
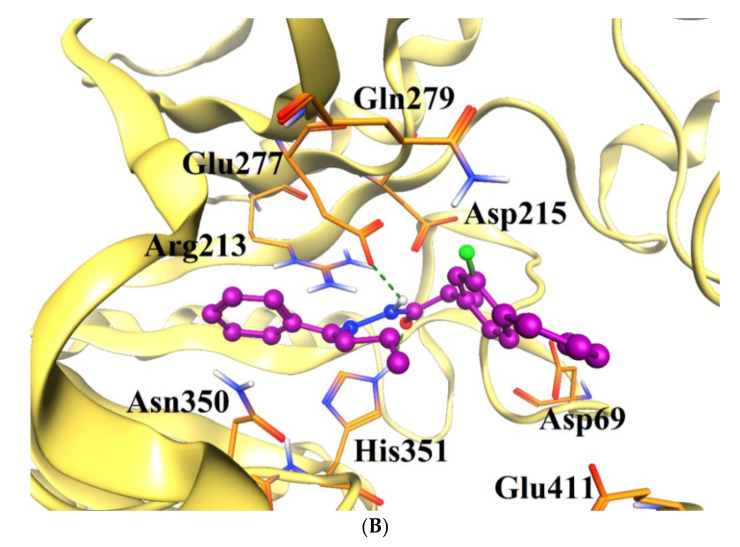
Figure 3.
(A) The docked orientations of all the active compounds are shown in the active site of α-glucosidase enzyme. The entrance of the active site and the hydrophobic pocket is displayed in the surface model, the compounds are presented in cyan ball and stick model. (B) The binding mode of the most active compound (5k, shown in magenta ball and stick model) is displayed in the active site of α-glucosidase. The active site residues are presented in orange stick model, and the protein is shown in gold ribbon. The H-bonds are displayed in green dotted line.


