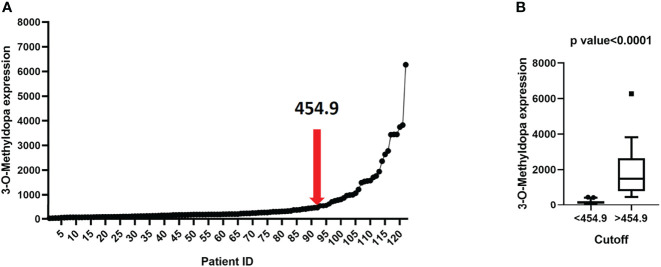
Figure 4.
3-O-Methyldopa expression cutoff visualization. (A) Scatter plot reporting 3-O-Methyldopa expression in 122 NB patients. Cutoff, selected by the Elbow method, is reported within the plot. The relative rank position of the cutoff is shown by a red arrow. (B) Boxplot displaying the low or high 3-O-Methyldopa expression in 122 NB patients according to the cutoff value. Boxplot was visualized using Tukey’s method. Significance of the expression difference between low and high 3-O-Methyldopa expression was carried out by unpaired student’s t test. P value is reported on top of the panel.

