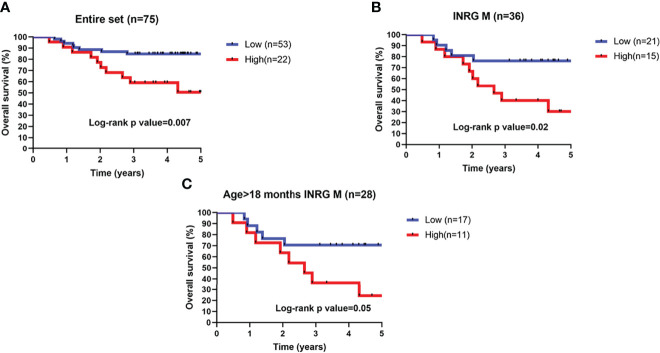
Figure 6.
Kaplan–Meier estimates and significance of NB patient OS by 3-O-Methyldopa expression. Kaplan-Meier curves show OS of NB patients with high (red) or low (blue) 3-O-Methyldopa expression in a time interval of 5 years. OS is displayed in years. To enhance reliability, data include alive patients with at least 3-years of follow-up. Low or high 3-O-Methyldopa expression was determined according to a cutoff of 454.9 determined with the Elbow method for the second dataset. Plots are relative to (A) All patients, (B), stage M tumors and (C) high-risk patients older than 18 months with stage M tumor. Plots are entitled with the characteristics of the patients in the sub-population. Survival curves were compared by log-rank test. The number of patients with low or high 3-O-Methyldopa expression is reported within brackets in the legend.

