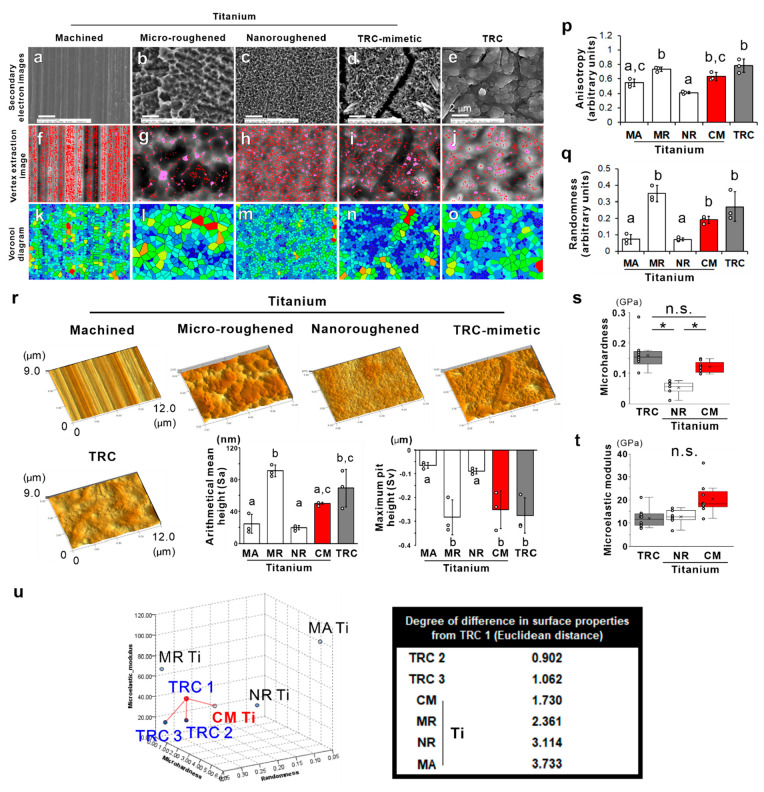
Figure 1.
Topographic and micromechanical features of TRC and titanium surfaces. Secondary electron images under SEM and corresponding vertex extraction images and Voronoi diagrams of (a, f, and k) machined (MA), (b, g, and l) microroughened (MR), (c, h, and m) nanoroughened (NR), and (d, i, and n) TRC-mimetic (CM) titanium surfaces and (e, j, and o) TRC, respectively. (p) Anisotropy and (q) randomness in the vertex distribution on titanium and TRC surfaces were measured by analyzing vertex extraction images and Voronoi diagrams. (r) Bird’s-eye view of 3D reconstruction images (panels) and vertical roughness parameters (histograms) on titanium and TRC surfaces by 3D SEM. Three independent regions on one sample. Data are presented as the mean ± SD with dot plots. Different letters indicate statistically significant differences between them (p < 0.05; Tukey’s HSD test). (s) Microhardness and (t) microelastic modulus measured by nanoindentation on NR and CM titanium surfaces and TRC surfaces. Seven to ten independent spots on one surface. Data are presented as box and dot plots with a mean point. *Statistically significant differences among NR and CM titanium and TRC surfaces (p < 0.05; Tukey’s HSD test) (s). n.s. indicates no statistically significant differences between TRC and CM titanium surfaces (p > 0.05; Tukey’s HSD test) (s) or among TRC and NR and CM titanium surfaces (p > 0.05; Tukey’s HSD test) (t). (u) Multidimensional plots (left) of the horizontal pattern of vertex distribution, vertical roughness, and micromechanical properties of TRC1–TRC3 and titanium disks with an MA, MR, NR, or CM surface. The Euclidean distance (right) between TRC1 and others measured by k nearest neighbor analysis on multidimensional plots. TRC, tooth root cementum; SEM, scanning electron microscopy; HSD, honestly significant difference; SD, standard deviation.

