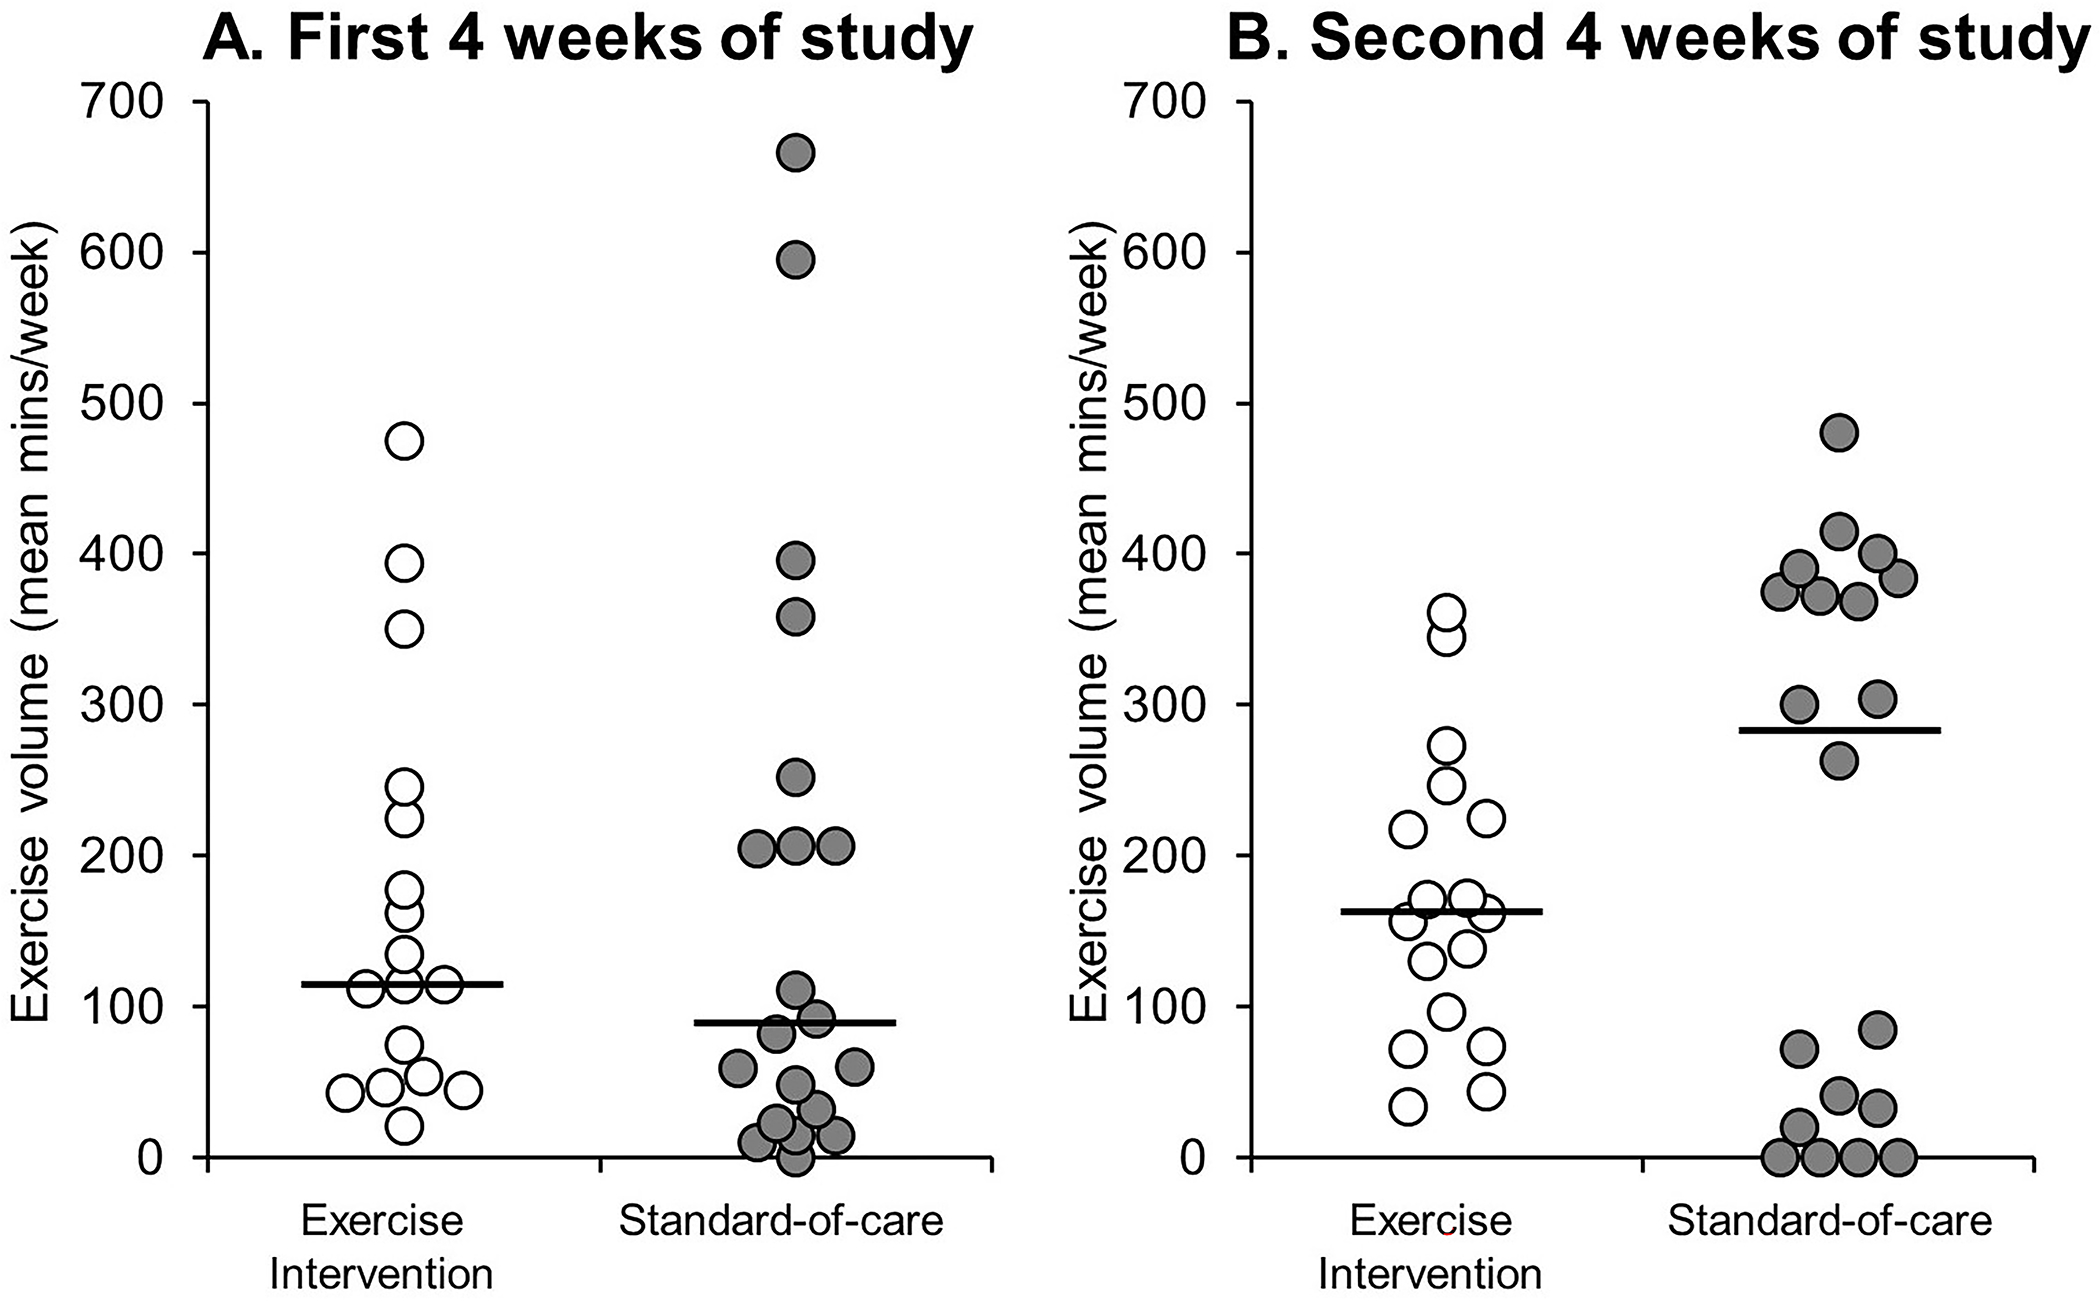
Figure 3.

Individual data points describing the distribution of average weekly exercise volume (mins/week) for those randomized to the exercise intervention and standard-of-care groups (A) during the first 4 weeks of the study, and (B) the second 4 weeks of the study. The solid black line represents the group median value. Note: There were no significant differences between groups during the first 4 weeks (p=0.52) or second 4 weeks (p=0.59) of the study.
