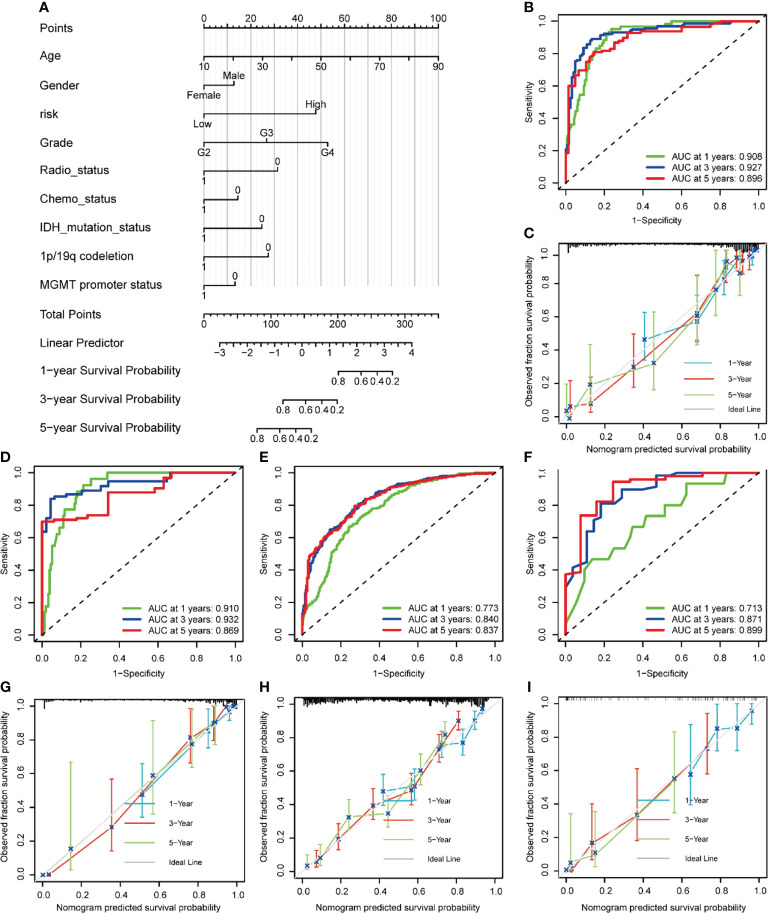
Figure 12.
Construction and validation of a nomogram to predict survival of patients with glioma. (A) Nomogram for predicting the 1-, 3-, 5-year survival of glioma patients in the training set. (B) ROC curves of the nomogram for predicting the sensitivity and specificity of 1-, 3-, 5-year survival in glioma patients in the training dataset. (C) Calibration curves of the nomogram for predicting 1-, 3-, and 5-year survival in glioma patients in the training dataset. (D-F) ROC curves of the nomogram for predicting the sensitivity and specificity of 1-, 3-, 5-year survival in glioma patients in the TCGA testing dataset(D), CGGA (E), and Rembrandt (F). (G-I) Calibration curves of the nomogram for predicting 1-, 3-, 5-year survival in glioma patients in the TCGA testing dataset (G), CGGA (H), Rembrandt (I).

