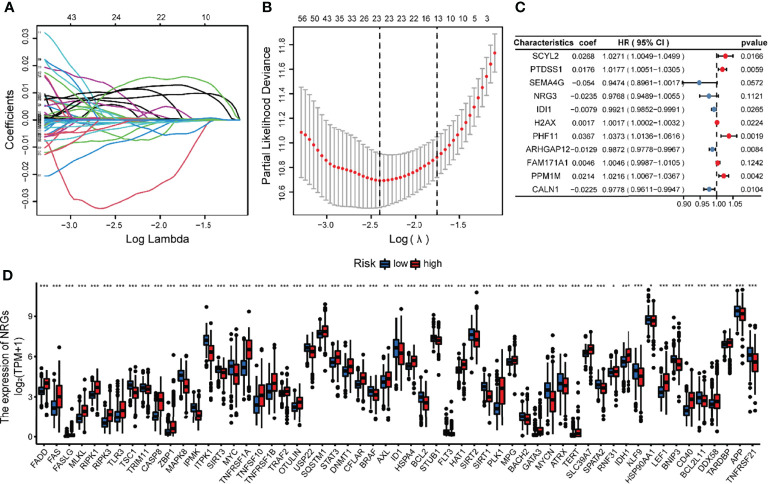
Figure 6.
Identification of representative candidate prognostic genes and differential expression of NRGs between the high and low-risk groups. (A) The LASSO regression analysis of the candidate prognostic genes. (B) The partial likelihood of deviance of the prognostic genes. (C) Forest plot of the multivariate Cox regression analysis for candidate genes. (D) The differential expression of NRGs between the high and low-risk groups. ***P<0.001, **P<0.01, *P<0.05.

