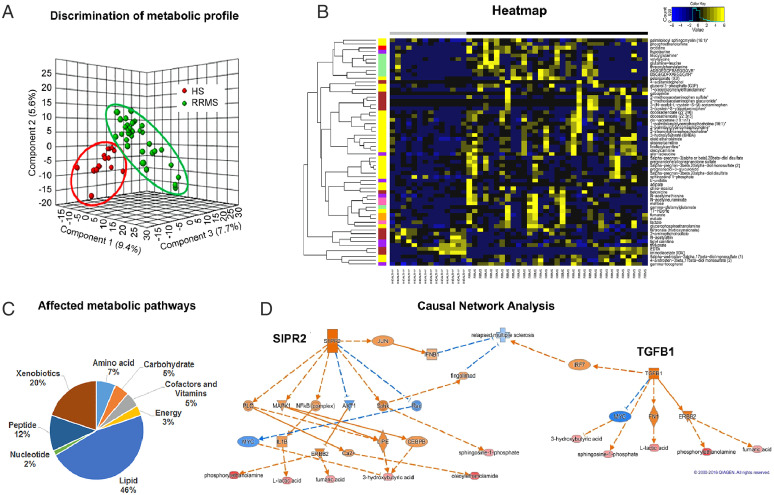
Fig. 1.
Patients with RRMS show an altered metabolic state metabotype compared with HS. (A) Three-dimensional PLS-DA plots showing significant discrimination of RRMS and HS. (B) Pie chart depicting the classification of metabolic perturbations in the serum of patients with RRMS compared with HS. (C) Heat map representative of the hierarchal clustering of the 60 metabolites from each of the replicates of serum from RRMS and HS. Shades of yellow represent elevation of a metabolite and shades of blue represent decrease of a metabolite relative to its mean level in these samples (see color scale). (D) Ingenuity’s IPA software CNA report identified G protein-coupled S1PR2 and TGF-β1 as master regulators predicted to be activated based on the altered levels of metabolites (bottom layer). Shades of orange shows prediction of activation and shades of blue shows prediction of inhibition. Bottom layer of these CNAs are metabolites that are differential between RRMS and HS, while shades of red shows up-regulation in RRMS.

