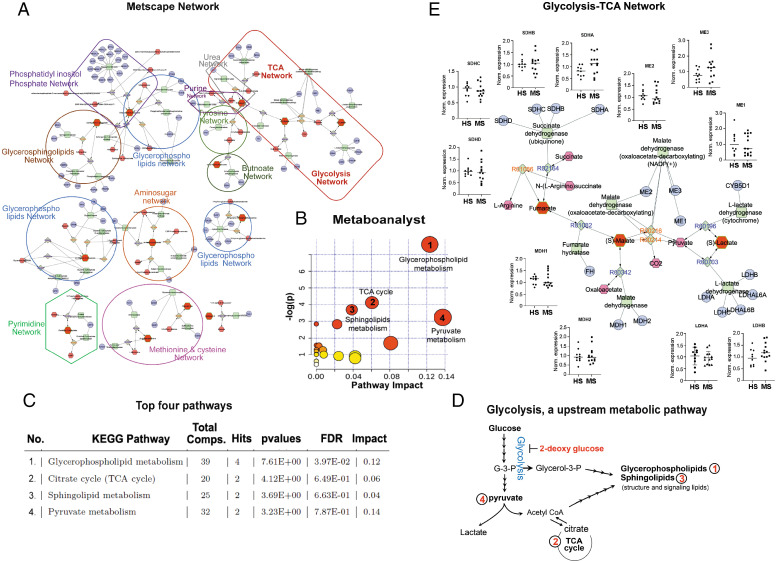
Fig. 2.
Bioinformatics analysis identified glycolysis as an upstream to the altered metabolic pathways in RRMS. (A) Visualization and interpretation of metabolomic network of patients with RRMS using Metscape in the context of human metabolic networks. In Metscape, compounds are represented as hexagons, reactions are diamonds, enzymes are squares, and genes are circles. Input metabolites are represented as red hexagons with green border. (B) Sixty metabolites that displayed significantly different abundance between RRMS and HS were subjected for the pathway enrichment analysis (y axis, enrichment P values) and the pathway topology analysis (x axis, pathway impact values, and indicative of the centrality and enrichment of a pathway) in the pathway module of MetaboAnalyst 4.0. The color of a circle is indicative of the level of enrichment significance, with red being high and yellow being low. Bigger size of a circle is proportional to the higher impact value of the pathway. (C) The top four pathways that arise with low P values and with high impact are indicated in the table format. (D) Schematic indicating glycolysis is upstream to the four altered metabolic pathways identified in RRMS. (E) Schematic depicting the comparative analysis of gene expression between HS and RRMS cases for the enzymes involved in glycolytic-TCA pathway, linked with altered metabolites found in RRMS.

